Break-even win rate: why a 2-to-1 chart ratio excludes costs
Understand what a chart-distance break-even percentage leaves out, and how an explicitly hypothetical fixed-cost model changes the arithmetic without estimating trading probability or success.
What the chart ratio shows
The risk/reward calculator compares the distance from entry to stop with the distance from entry to target. Its theoretical break-even win rate is risk divided by risk plus reward. With 100 units of modeled price risk and 200 units of modeled reward, the ratio is 2-to-1 and the displayed break-even percentage is 33.33%. The calculation is about those price distances; it does not say how likely either level is to be reached.
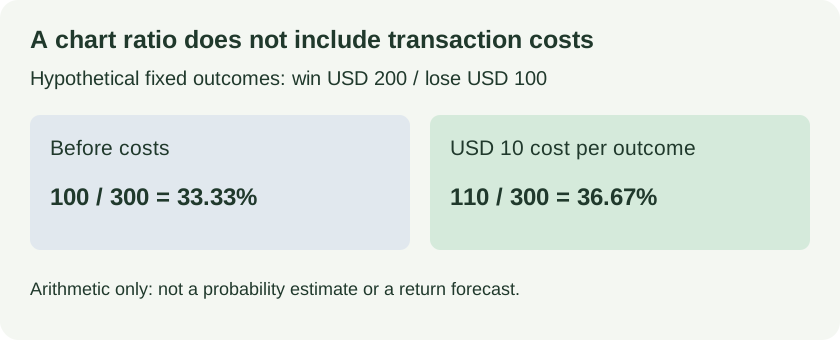
Hypothetical fixed outcomes: win USD 200 / lose USD 100; Before costs: 100 / 300 = 33.33%; USD 10 cost per outcome: 110 / 300 = 36.67%.
Open full-size diagram ↗A hypothetical two-outcome calculation
In a hypothetical model, every winning trade earns USD 200 gross and every losing trade loses USD 100 before costs. The 2-to-1 ratio gives a gross break-even win rate of 100 / 300, or about 33.33%. If each outcome incurs USD 10 of costs, the net outcomes become plus USD 190 and minus USD 110. Net break-even is then 110 / (190 + 110), or about 36.67%. These fixed outcomes are invented; this is not a probability estimate or a strategy forecast. Variable costs, slippage and partial exits can change the model.
What the calculator displays
The tool displays the reward/risk ratio and theoretical break-even win rate from entry, stop and target price distances, plus a Costs: Excluded row. Independently, using the tool's default long example inputs (entry 1.1000, stop 1.0950, target 1.1100) gives 50 units of risk, 100 of reward, a 2:1 reward/risk result, and 33.33% break-even. There is no cost-adjusted break-even input or result in this calculator; the fixed-cost arithmetic above is an educational illustration, not a tool output.
Limits of the model
Even a cost-adjusted break-even calculation is only arithmetic under its stated assumptions. Actual costs can vary, and slippage or partial exits can change realized outcomes. Break-even is not the probability of a win, a forecast, or evidence that a strategy will succeed. Check what costs are included in any model before interpreting its ratio.
Sources and conventions
Examples are hypothetical. Arithmetic follows the formulas documented in our methodology. Broker contract specifications determine actual lot, margin and execution conditions. These sources document definitions and data; a source link does not imply endorsement of SanForex or a trading service.
These materials are prepared with AI assistance and checked against worked examples and deterministic calculation tests where applicable. They are not an expert suitability assessment or investment advice.
Open risk / reward tool ↗