Arithmetic and geometric returns: two different averages
An arithmetic mean adds period returns and divides by their count.
Ask whether you are averaging observations or growth
An arithmetic mean adds period returns and divides by their count. A geometric mean uses the compounded growth factor over equally spaced periods. They answer different questions. The arithmetic average is not generally the return that would reproduce the ending balance if repeated each period.
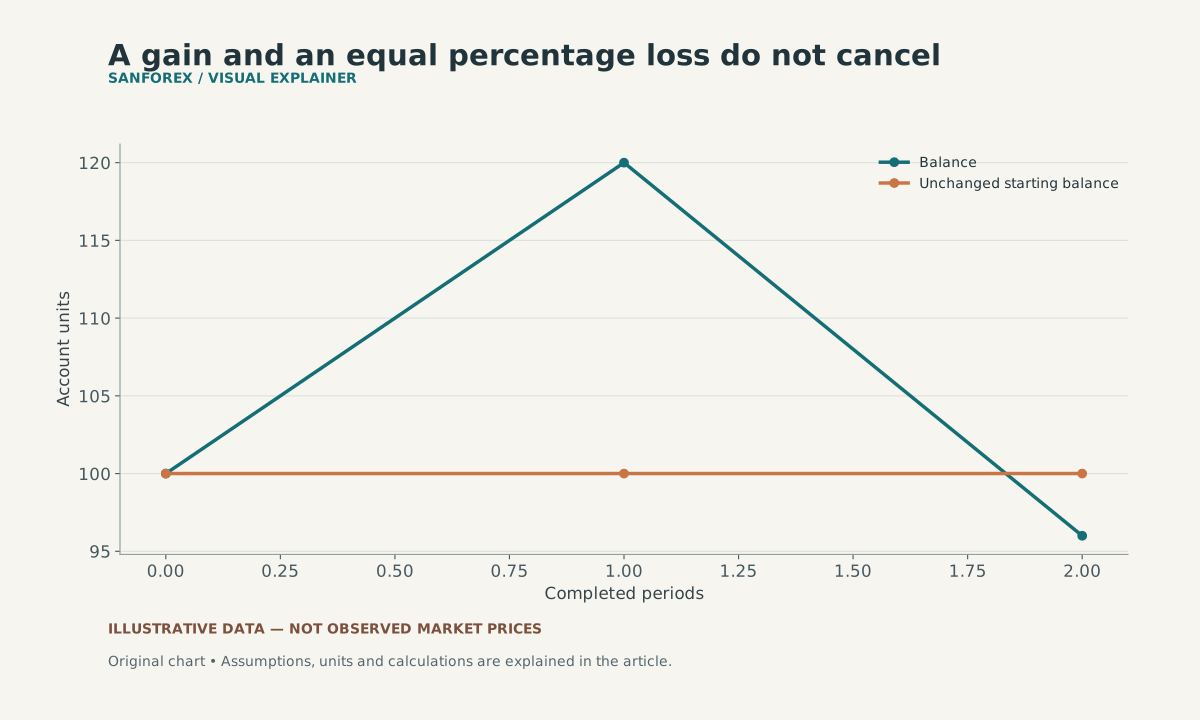
Starting at 100, a 20% gain followed by a 20% loss ends at 96. The arithmetic average return is zero, while the compounded balance is 4% lower. No cash flows or costs are included.
Open full-size diagram ↗Follow an invented two-period account
Start with 100 units, gain 20% to reach 120, then lose 20% to finish at 96. The arithmetic average is zero, but the cumulative return is −4%. The geometric average is the square root of 0.96 minus one, approximately −2.0204% per period. Repeating that factor twice reproduces 96. The two periods are assumed equally long, with no deposits, withdrawals or separate charges.
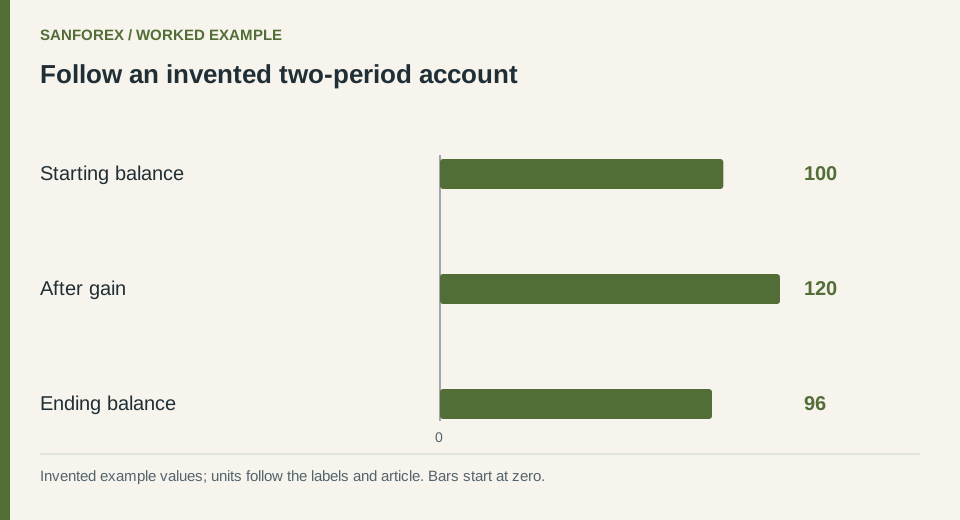
Worked example: Starting balance: 100; After gain: 120; Ending balance: 96. Invented values; units follow the row labels and article.
Open full-size diagram ↗Check the order of operations
Multiply growth factors such as 1.20 and 0.80 before subtracting one. Do not multiply signed percentage returns themselves. An ordinary geometric calculation also requires valid growth factors; a complete loss or values below the model’s domain need separate treatment. Keep missing periods distinct from zero-return periods.
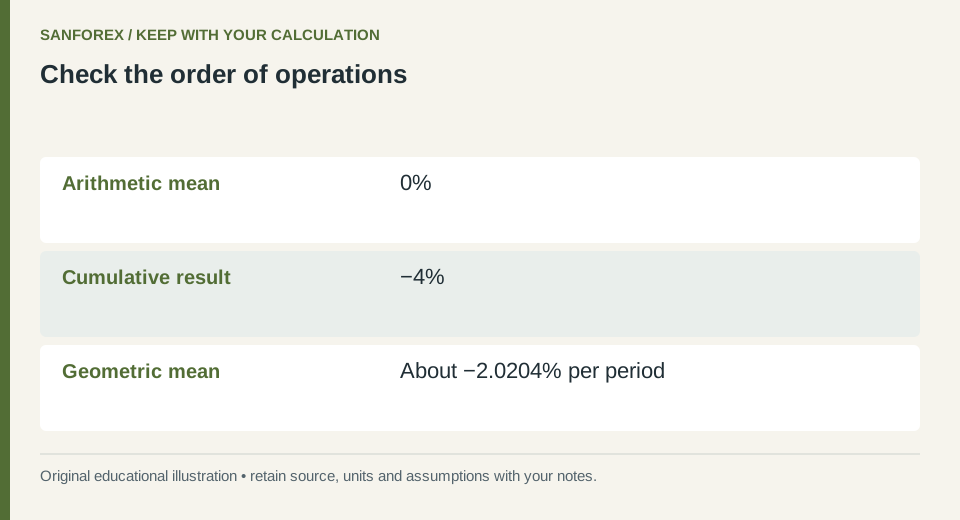
Calculation checklist: Arithmetic mean: 0%; Cumulative result: −4%; Geometric mean: About −2.0204% per period. Preserve these definitions when reproducing the example.
Open full-size diagram ↗Label the result honestly
State period length, number of observations, cash-flow treatment and whether costs are included. These two invented returns are not a strategy record. A historical average does not establish a future expected return. SanForex’s drawdown calculator handles a different question—recovery from a stated decline—not automatic geometric-return analysis.
Sources and conventions
Examples are hypothetical. Worked examples state their formulas and assumptions in the article; our methodology explains the related calculators. Broker contract specifications determine actual lot, margin and execution conditions. These sources document definitions and data; a source link does not imply endorsement of SanForex or a trading service.
These materials are prepared with AI assistance and checked against worked examples and deterministic calculation tests where applicable. They are not an expert suitability assessment or investment advice.
Open drawdown recovery tool ↗