GDP per capita: output can rise while output per person falls
An illustrated hypothetical example showing how population growth can outpace real output growth and lower output per person.
Two measures, two questions
Total GDP describes the scale of production. GDP per capita divides GDP by population and describes average output per person. BEA presents per-capita GDP as a way to standardize for population, while noting it is a proxy rather than a complete measure of well-being. For a meaningful comparison, use real output and a population estimate for matching periods.
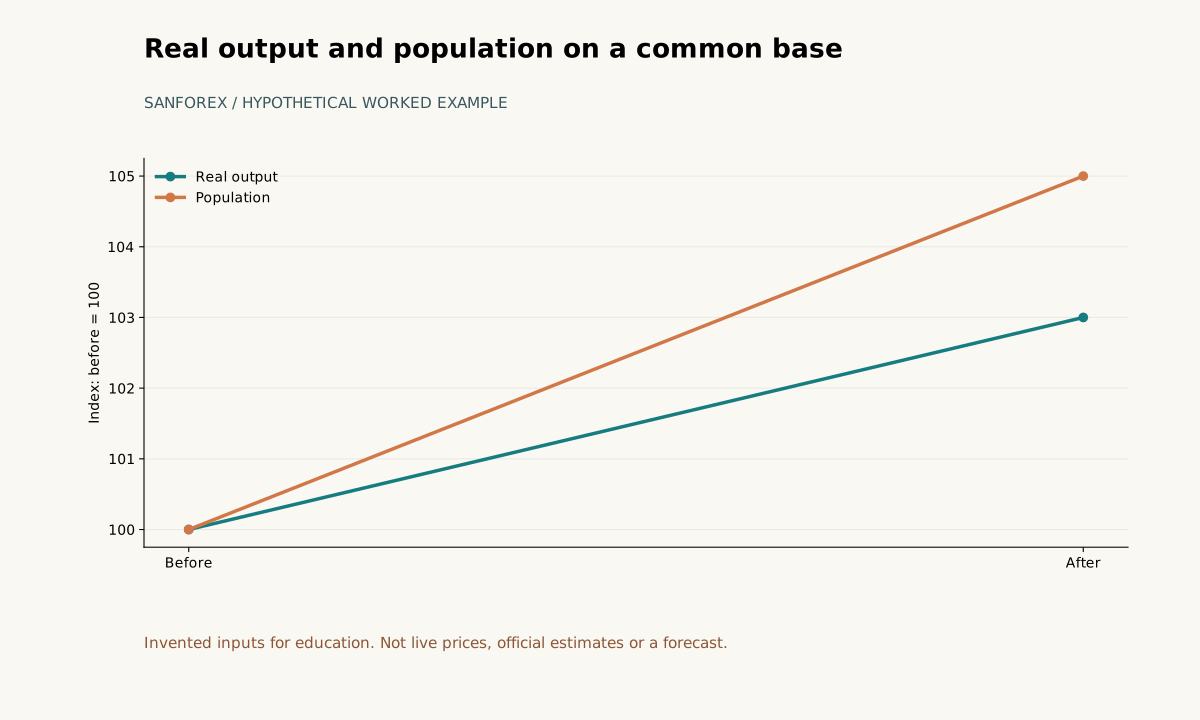
Real output index 103.00; population index 105.00. Original invented inputs.
Open full-size diagram ↗A hypothetical worked example
In a hypothetical economy, real output rises from 1000 to 1030 units while population rises from 100 to 105 people. Output per person falls from 10 to about 9.8095 units, a change of about -1.90%, even though total output rises 3%. These are invented same-price-base quantities. The average is not a wage, disposable income or a statement that each person receives 9.8095 units.
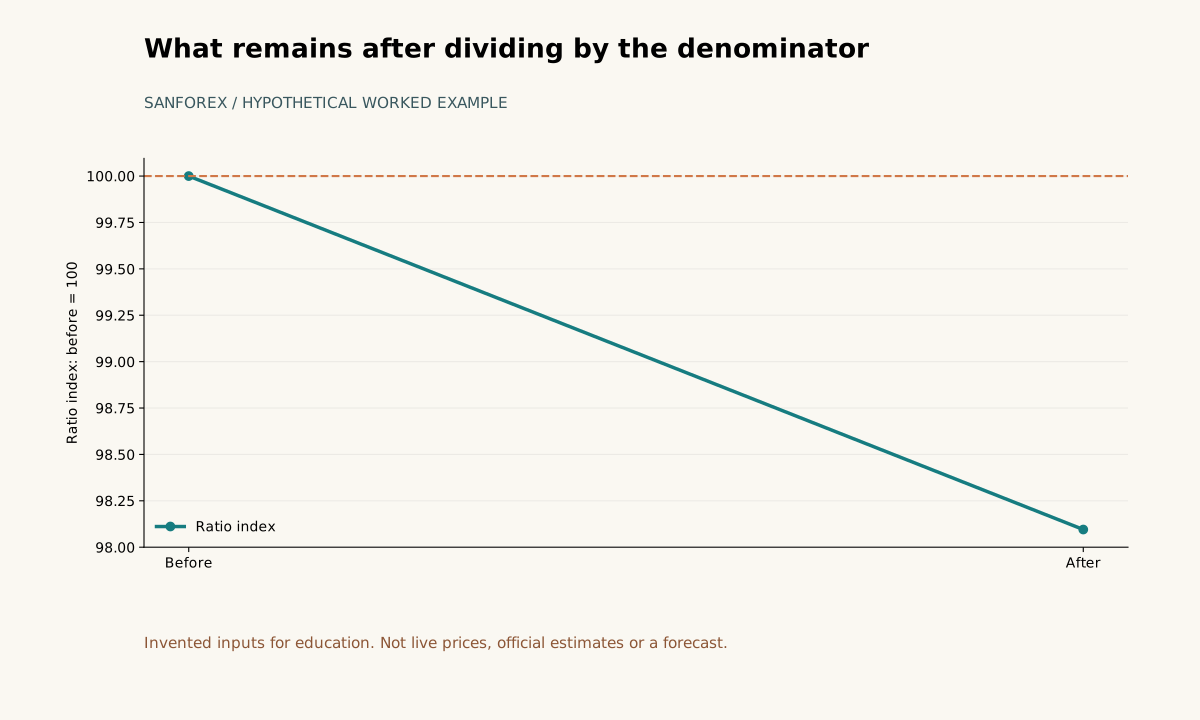
Ratio index moves from 100 to 98.0952, a change of -1.9048%.
Open full-size diagram ↗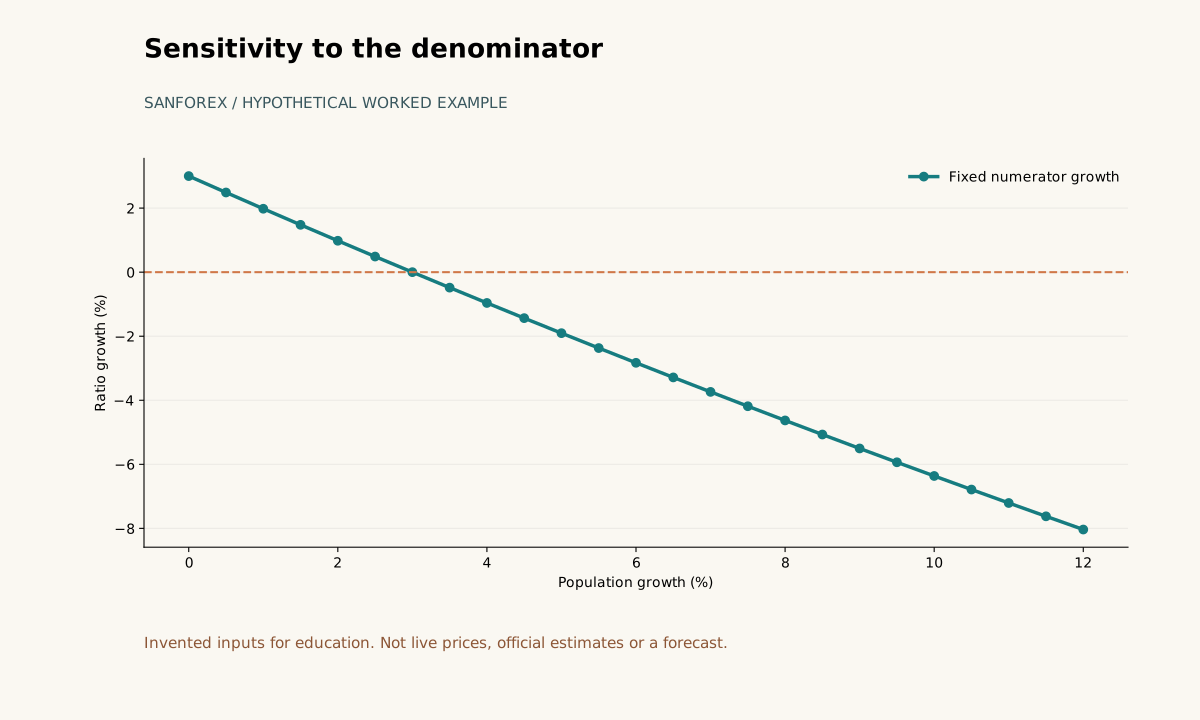
Numerator growth held at 3.00%; denominator growth varies from 0% to 12%. Scenarios, not forecasts.
Open full-size diagram ↗Reproduce the ratio change
First divide output by population in each period: 1000 / 100 = 10 and 1030 / 105 ≈ 9.809524 units per person. Then compare the ratios: (9.809524 / 10 - 1) × 100 ≈ -1.904762%. Equivalently, (1 + 0.03) / (1 + 0.05) - 1 = -0.01904762. Subtracting growth rates gives only an approximation. The SanForex currency converter converts currency amounts; it does not calculate GDP per capita or this growth comparison.
Average output is not a distribution
A per-capita figure is an average, not an allocation rule. People and groups can have different outcomes even when the average is unchanged. GDP measures production; it does not show household disposable income, inequality or what any particular person can spend. Those questions need other measures and evidence.
Keep units and periods comparable
Check that output and population cover compatible periods and that the output series uses a consistent price basis. Note the unit scale, population source and release vintage. Constant-price domestic output, nominal output and currency-converted comparisons answer different questions; label the basis instead of blending them.
Use the result carefully
Report total output growth and per-capita growth separately. This arithmetic explains how the two can move in opposite directions; it does not establish a complete account of living standards, predict future growth or determine a currency valuation. For observed data, consult the publisher's series definitions and revisions.
Sources and conventions
Examples are hypothetical. Worked examples state their formulas and assumptions in the article; our methodology explains the related calculators. Broker contract specifications determine actual lot, margin and execution conditions. These sources document definitions and data; a source link does not imply endorsement of SanForex or a trading service.
These materials are prepared with AI assistance and checked against worked examples and deterministic calculation tests where applicable. They are not an expert suitability assessment or investment advice.
Open currency converter tool ↗