PPI and CPI: different price perspectives, not a fixed pipeline
US PPI and CPI differ in scope, price perspective and construction.
Identify whose prices the measure follows
US PPI and CPI differ in scope, price perspective and construction. BLS’s PPI documentation explains these differences. A producer-price measure is not simply the same consumer basket observed a fixed number of months earlier. Comparing headline percentages without checking their definitions can create a misleading story.
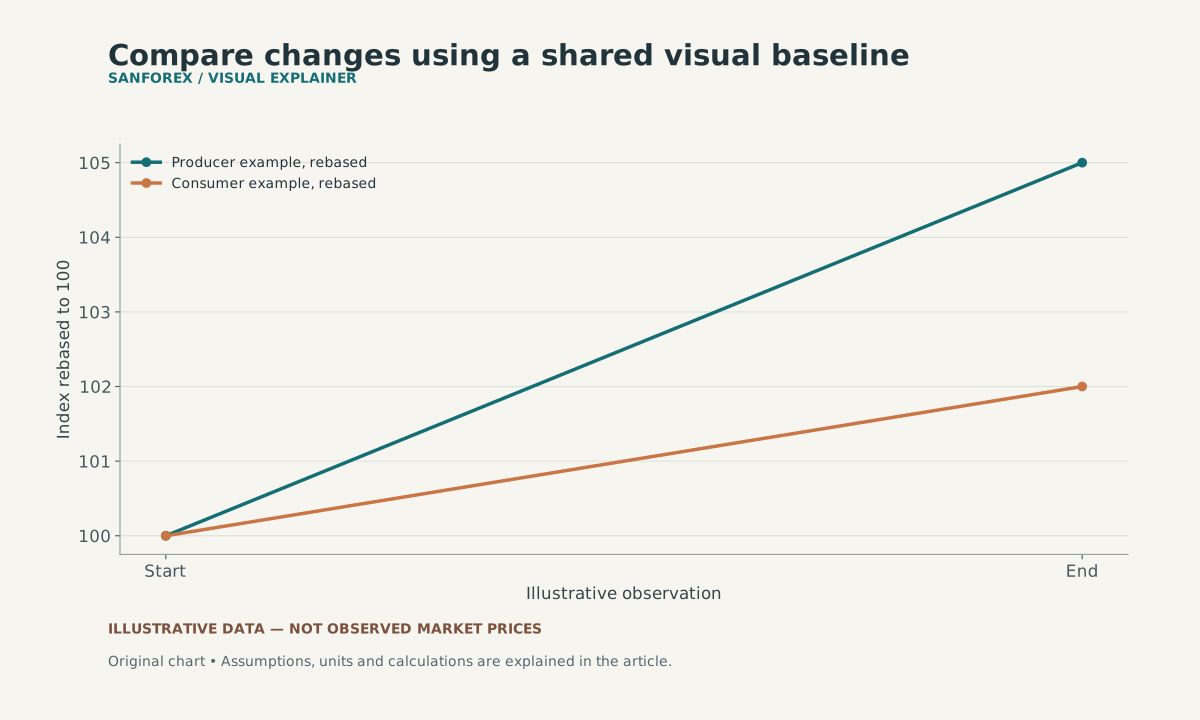
The article’s producer and consumer series rise 5% and 2%. Rebasing their separate initial levels to 100 makes these changes visible without subtracting incompatible raw index levels.
Open full-size diagram ↗Calculate two independent illustrative series
Imagine a producer index moving from 200 to 210 and a consumer index moving from 300 to 306 over the same stated period. Their changes are 5% and 2%. The difference is three percentage points. Subtracting the index levels, 306 − 210 = 96, has no useful interpretation as a price gap because the indexes have separate reference scales and coverage.
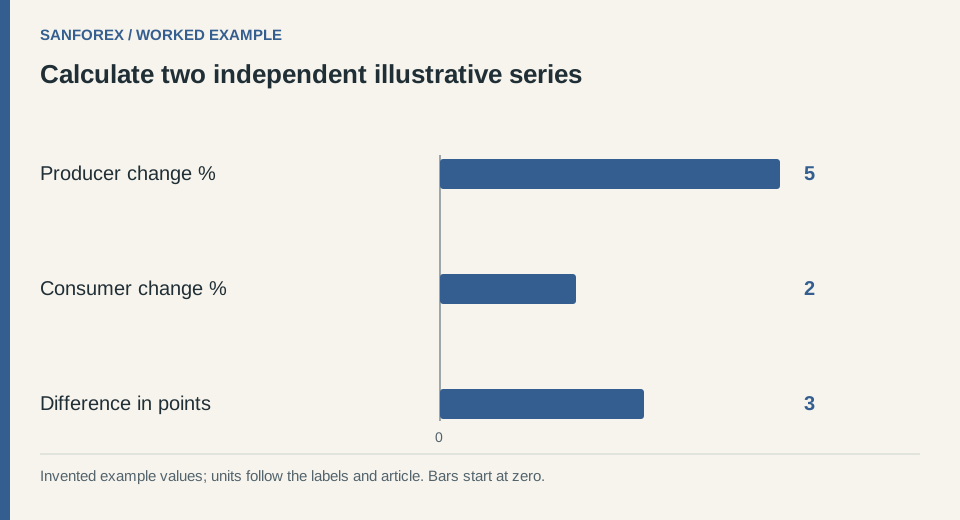
Worked example: Producer change %: 5; Consumer change %: 2; Difference in points: 3. Invented values; units follow the row labels and article.
Open full-size diagram ↗Avoid a mechanical pass-through assumption
The illustrative 5% producer increase does not establish that consumer prices must rise 5% next month. Margins, input mixes, contracts, timing and the coverage of the two measures can differ. A claim about pass-through needs additional evidence and a defined model. It cannot be inferred from the two percentage changes alone.
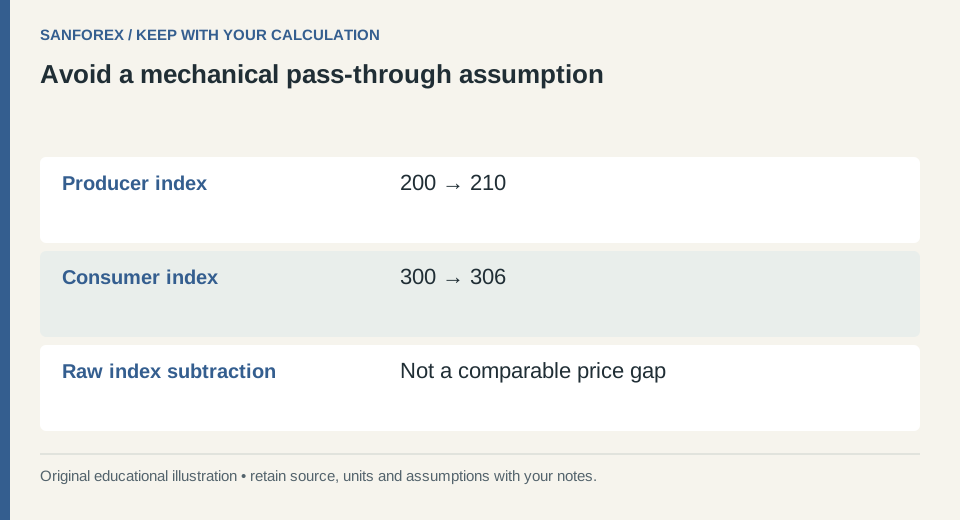
Calculation checklist: Producer index: 200 → 210; Consumer index: 300 → 306; Raw index subtraction: Not a comparable price gap. Preserve these definitions when reproducing the example.
Open full-size diagram ↗Make a comparable data extract
Store series identifiers, item coverage, adjustment status, period and release vintage. Compare growth rates over matching periods rather than raw index levels. SanForex’s currency tools do not estimate producer-to-consumer transmission. The purpose of this note is to prevent mismatched comparisons before forming an economic interpretation.
Sources and conventions
Examples are hypothetical. Worked examples state their formulas and assumptions in the article; our methodology explains the related calculators. Broker contract specifications determine actual lot, margin and execution conditions. These sources document definitions and data; a source link does not imply endorsement of SanForex or a trading service.
These materials are prepared with AI assistance and checked against worked examples and deterministic calculation tests where applicable. They are not an expert suitability assessment or investment advice.
Open currency converter tool ↗