Seasonally adjusted versus unadjusted data: compare like with like
A hypothetical example shows how seasonal adjustment can change the direction of a month-to-month comparison, and what to check before comparing published series.
Compare matching series
Seasonally adjusted data account for estimated recurring seasonal movements; unadjusted data retain those movements. The Bureau of Labor Statistics describes additive and multiplicative methods for its Current Employment Statistics series and notes that factors may be revised. Before comparing figures, check that the series, unit, reference period, and adjustment status match. A difference between headlines may reflect different definitions or adjustment status rather than contradictory measurements.
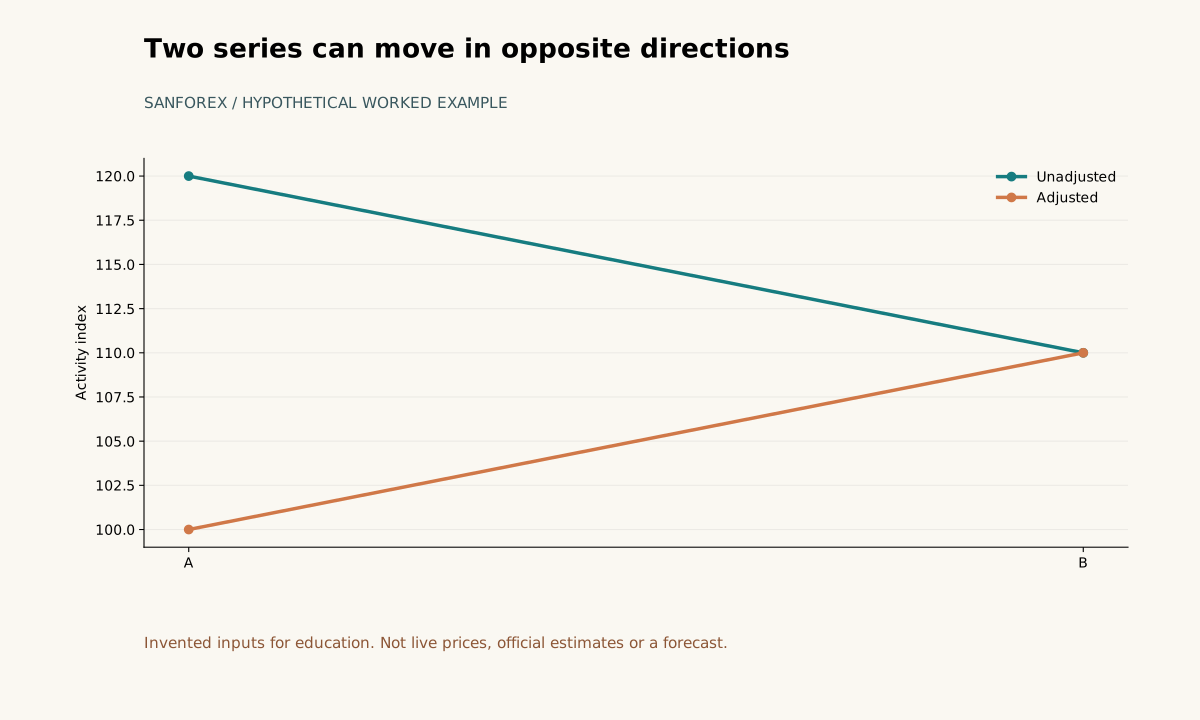
Raw 120 to 110; adjusted 100 to 110, using assumed factors 1.20 and 1.00.
Open full-size diagram ↗A hypothetical worked example
In a hypothetical multiplicative illustration, raw activity is 120 in Month A and 110 in Month B. Supplied seasonal factors are 1.20 and 1.00. Dividing gives adjusted levels of 100 and 110. The raw change is -8.33%, while the adjusted change is +10%. These invented factors are assumed, not estimated from two observations; this is not a reproduction of the BLS production model.
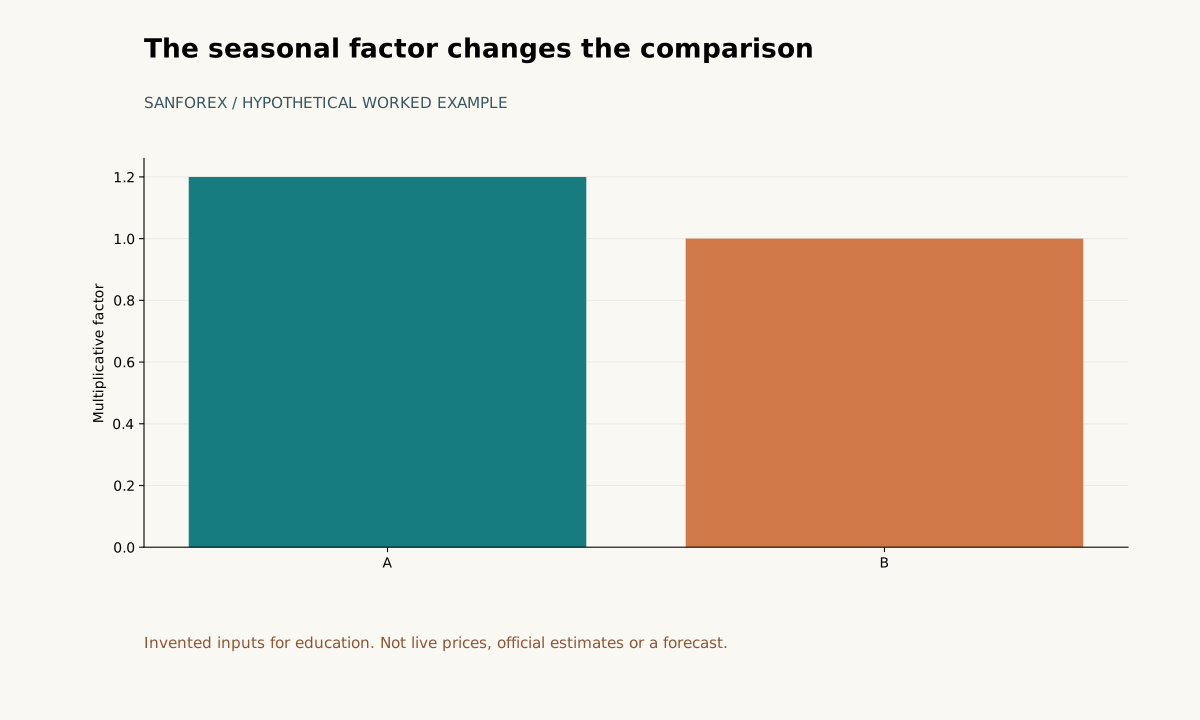
Illustrative seasonal factors: 1.20 in A and 1.00 in B; not estimated from real data.
Open full-size diagram ↗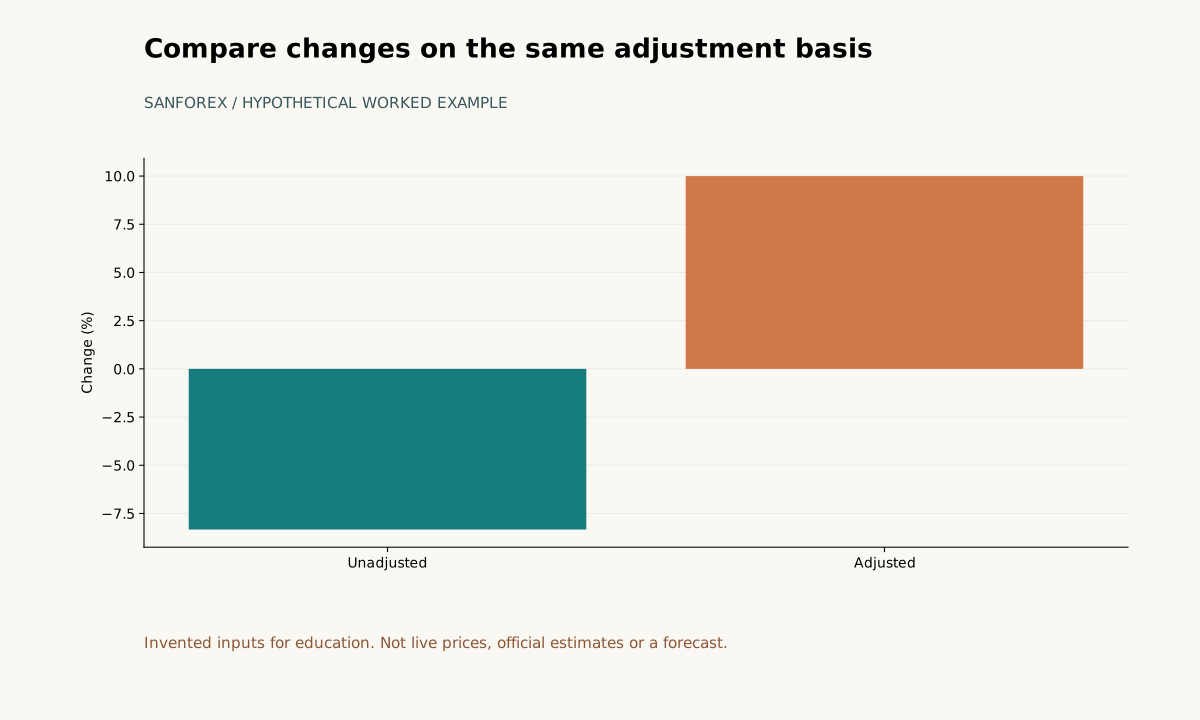
Raw change is -8.33%; adjusted change is +10%. Assumed multiplicative decomposition.
Open full-size diagram ↗Reproduce the arithmetic
For each month, divide the raw level by its supplied factor: 120 ÷ 1.20 = 100 and 110 ÷ 1.00 = 110. Compute each percentage change from its own starting level: (110 − 120) ÷ 120 × 100 = −8.33% raw; (110 − 100) ÷ 100 × 100 = +10% adjusted. These are educational calculations from assumed inputs. The currency converter displays currency conversions; it does not calculate seasonal factors or seasonally adjusted series, so it is not needed for this example.
Keep the inputs and labels visible
Preserve raw observations and factors in separate columns, and label calculated adjusted levels as illustrative. Two observations cannot establish a recurring seasonal pattern; the factors here are assumed. Do not infer an official seasonal effect by subtracting the two percentage changes. For a published series, use the publisher's adjustment status, methodology, and revision notes, and compare like periods and units.
What this example can show
With the stated factors, raw activity falls while the illustrative adjusted level rises. The arithmetic demonstrates how that can happen; it does not identify a cause, forecast a later observation, or reproduce a statistical agency's production model. It is not current economic data. For interpretation of an actual release, consult that series' publisher and documentation.
Sources and conventions
Examples are hypothetical. Worked examples state their formulas and assumptions in the article; our methodology explains the related calculators. Broker contract specifications determine actual lot, margin and execution conditions. These sources document definitions and data; a source link does not imply endorsement of SanForex or a trading service.
These materials are prepared with AI assistance and checked against worked examples and deterministic calculation tests where applicable. They are not an expert suitability assessment or investment advice.
Open currency converter tool ↗