A perfect sample correlation is not a causal explanation
Pearson correlation summarizes a linear relationship between paired observations.
Match observations before calculating
Pearson correlation summarizes a linear relationship between paired observations. Pairing is essential: matching one series’ Monday value to another series’ Tuesday value changes the question. In this invented example, X is 1, 2, 3 and Y is 2, 4, 6 at the same three timestamps. Y equals twice X, giving a correlation of plus 1.
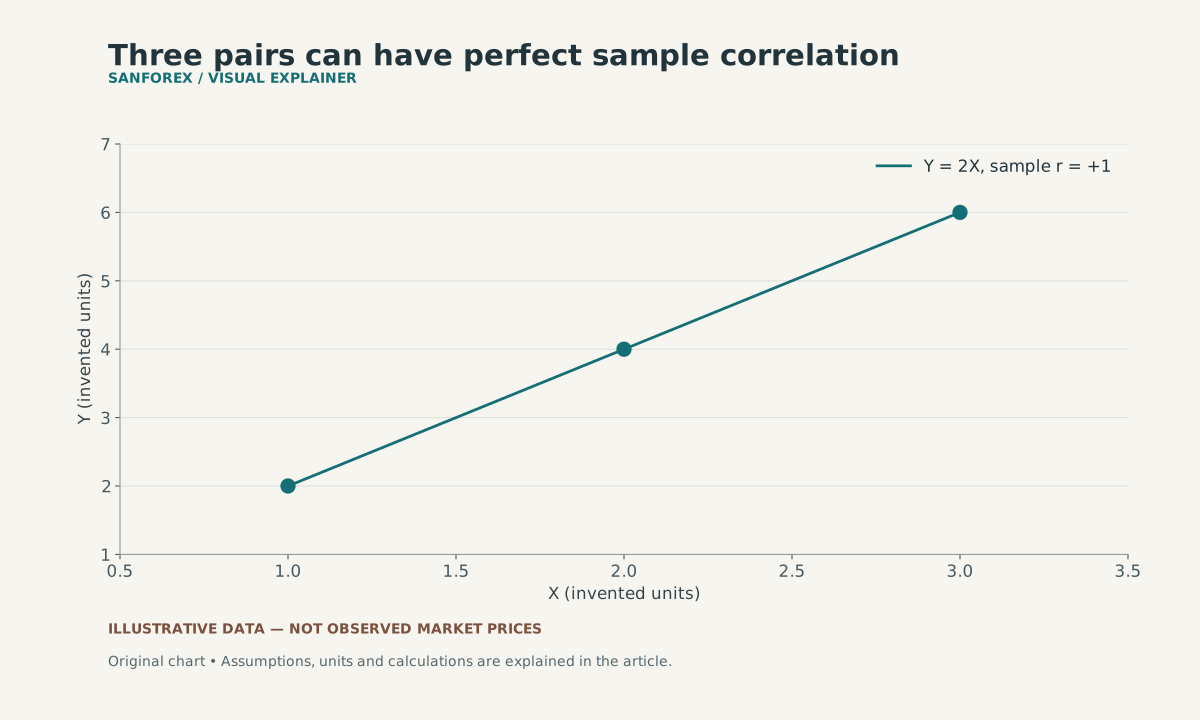
The invented pairs (1,2), (2,4) and (3,6) lie exactly on Y = 2X, so their Pearson correlation is +1. Three points do not establish causation or a stable future relationship.
Open full-size diagram ↗Inspect the centered arithmetic
The X deviations from its mean are minus 1, zero and plus 1. The Y deviations are minus 2, zero and plus 2. The sum of cross-products is 4, while the square root of the two squared-deviation sums multiplied together is also 4. Their ratio is 1. If Y were 6, 4, 2 instead, the result would be minus 1.
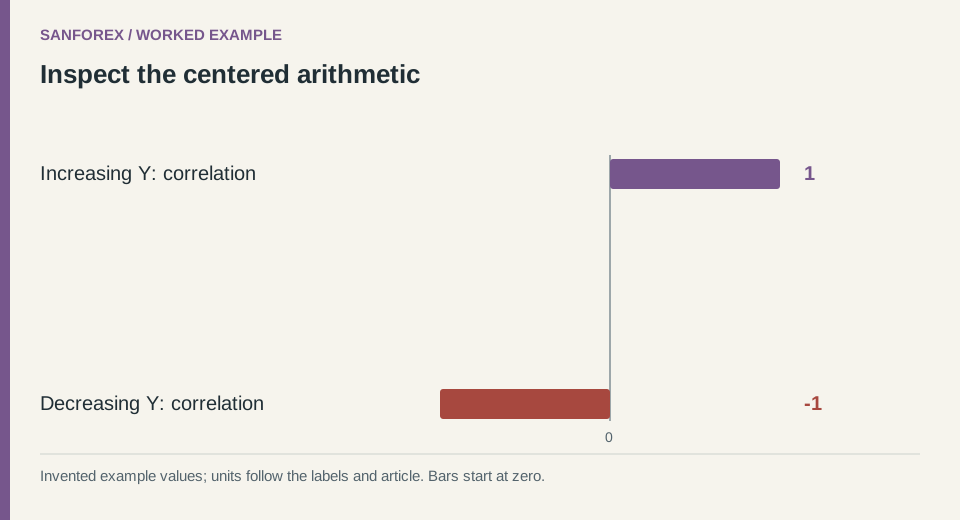
Worked example: Increasing Y: correlation: 1; Decreasing Y: correlation: -1. Invented values; units follow the row labels and article.
Open full-size diagram ↗Recognize what this does not establish
Three paired values provide very little evidence about a stable relationship. A perfect sample coefficient does not identify a cause or ensure a future hedge. If either series is constant, the usual denominator becomes zero and the coefficient is undefined. Reporting zero in that situation would confuse an unavailable calculation with an observed absence of linear association.
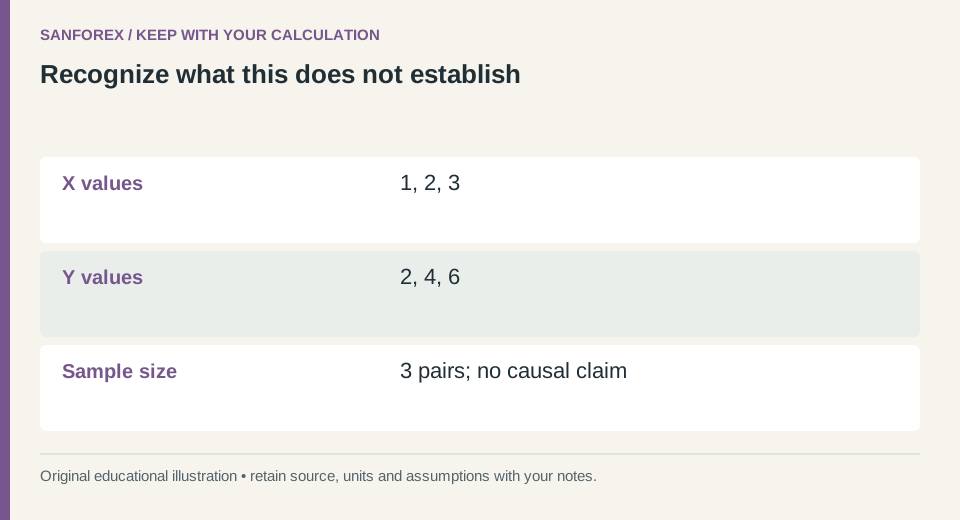
Calculation checklist: X values: 1, 2, 3; Y values: 2, 4, 6; Sample size: 3 pairs; no causal claim. Preserve these definitions when reproducing the example.
Open full-size diagram ↗Record the transformation and sample
State whether you used price levels, differences or returns, together with interval, dates and missing-pair handling. These transformations can give different correlations. Inspect a scatterplot and the raw pairs, not only the coefficient. The diagrams here are exact arithmetic demonstrations on invented data; they are not measured correlations between real markets or evidence for a trading recommendation.
Sources and conventions
Examples are hypothetical. Worked examples state their formulas and assumptions in the article; our methodology explains the related calculators. Broker contract specifications determine actual lot, margin and execution conditions. These sources document definitions and data; a source link does not imply endorsement of SanForex or a trading service.
These materials are prepared with AI assistance and checked against worked examples and deterministic calculation tests where applicable. They are not an expert suitability assessment or investment advice.
Open trading journal tool ↗