Compare differently priced series by rebasing to 100
Rebasing divides each observation by its own starting value and multiplies by 100.
Give both series the same starting point
Rebasing divides each observation by its own starting value and multiplies by 100. It lets readers compare relative price paths whose raw levels are different. Suppose series A starts at 20 and series B starts at 200. Both receive an initial index value of 100. This transformation does not make their risks, currencies or market exposures equivalent.
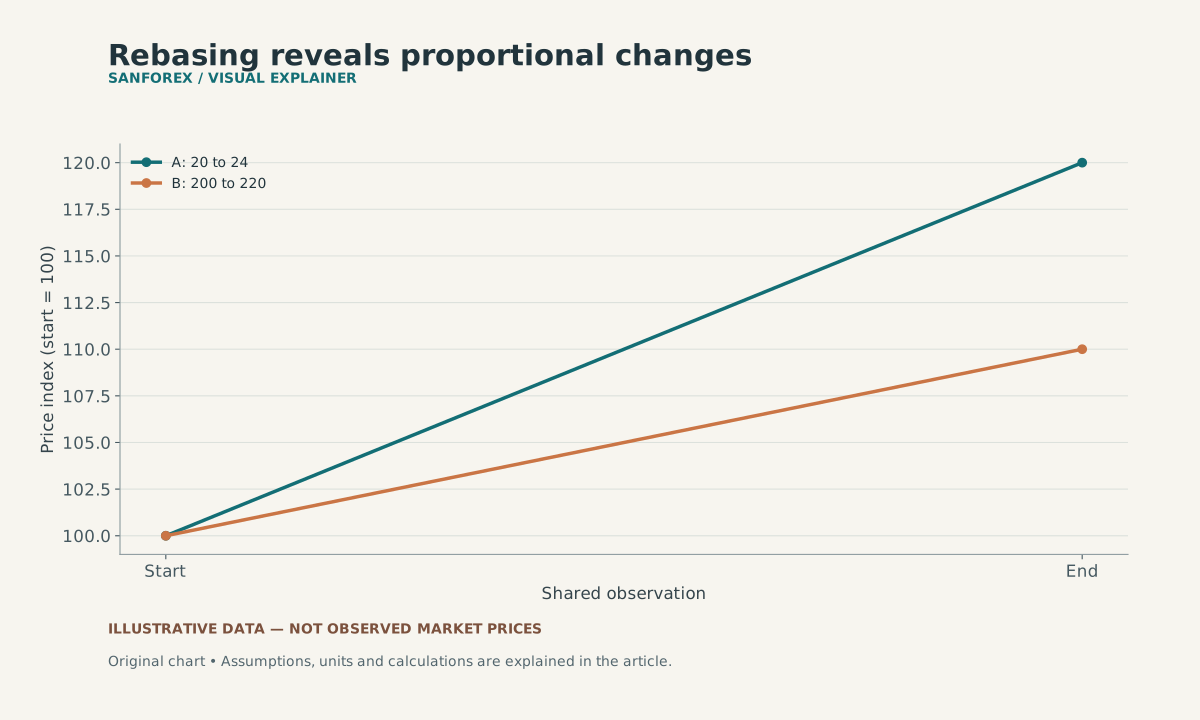
Series A rises from 20 to 24 and B from 200 to 220. On a common 100 baseline their endpoints are 120 and 110. These are price-only changes, not total returns.
Open full-size diagram ↗Calculate the rebased ending values
If A ends at 24, its index is 24 / 20 × 100 = 120. If B ends at 220, its index is 110. A rose 20% and B rose 10% over the chosen interval, although B had the larger absolute price change of 20 versus 4. The rebased chart answers the proportional-change question directly.
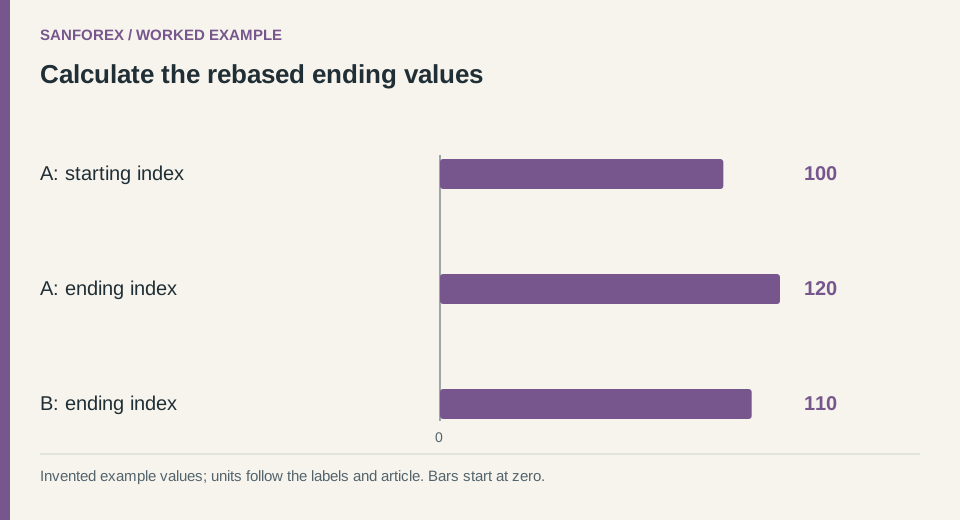
Worked example: A: starting index: 100; A: ending index: 120; B: ending index: 110. Invented values; units follow the row labels and article.
Open full-size diagram ↗Do not silently turn price into total return
A raw price series may omit distributions and other adjustments. A total-return series measures something different. For this example, no distributions, costs, leverage or currency conversion are included. If the series are denominated in different currencies, the chart compares local-currency price changes unless a separate common-currency conversion is explicitly applied.
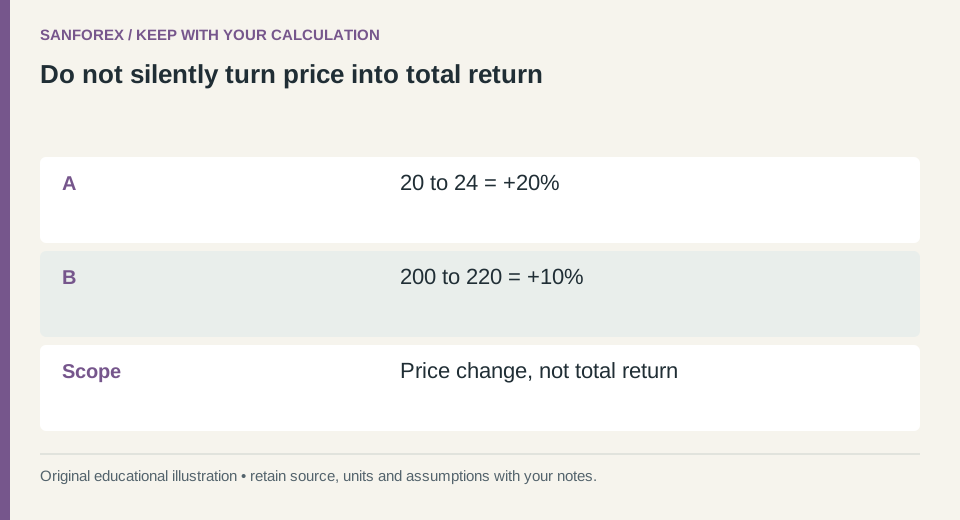
Calculation checklist: A: 20 to 24 = +20%; B: 200 to 220 = +10%; Scope: Price change, not total return. Preserve these definitions when reproducing the example.
Open full-size diagram ↗Make the baseline choice visible
Use the same starting and ending timestamps, and identify missing observations. Changing the baseline date changes the comparison window and can change the apparent winner. Save the original values beside the index so another reader can reproduce the transformation. An indexed past path is descriptive; it does not establish which asset will perform better next.
Sources and conventions
Examples are hypothetical. Worked examples state their formulas and assumptions in the article; our methodology explains the related calculators. Broker contract specifications determine actual lot, margin and execution conditions. These sources document definitions and data; a source link does not imply endorsement of SanForex or a trading service.
These materials are prepared with AI assistance and checked against worked examples and deterministic calculation tests where applicable. They are not an expert suitability assessment or investment advice.
Open trading journal tool ↗