Linear and logarithmic chart distance: the same prices, different view
A linear price axis gives equal distance to equal absolute changes.
Identify what equal vertical spacing means
A linear price axis gives equal distance to equal absolute changes. A logarithmic axis gives equal distance to equal ratios. The choice changes how a price path looks without changing its underlying observations. Before comparing slopes on two screenshots, read the axis setting and the displayed price range. A steep-looking line can partly reflect the chosen scale.
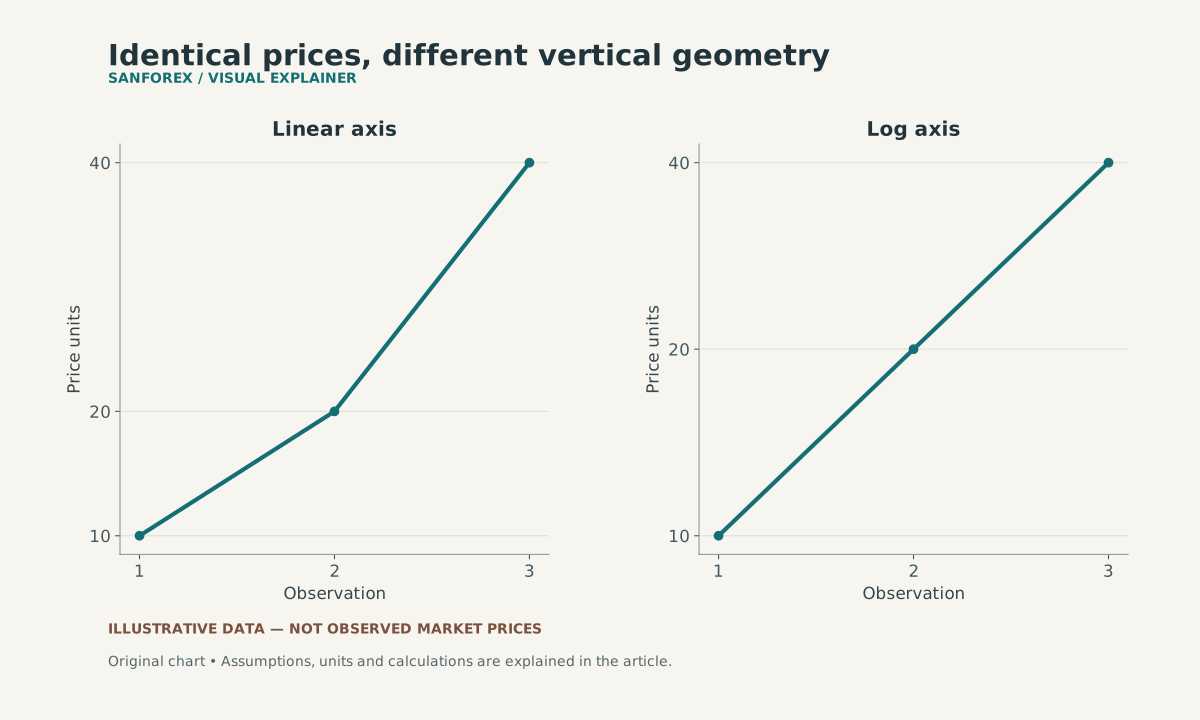
The same invented prices 10, 20 and 40 appear on linear and logarithmic axes. Both moves double the price; equal ratios have equal vertical distance on the log axis.
Open full-size diagram ↗Compare two doubling moves
In an invented sequence, price rises from 10 to 20 and then from 20 to 40. The absolute moves are 10 and 20, while both percentage changes are 100%. On a linear axis the second vertical move is twice the first. On a logarithmic axis the two moves have equal vertical distance because log(20 / 10) equals log(40 / 20).
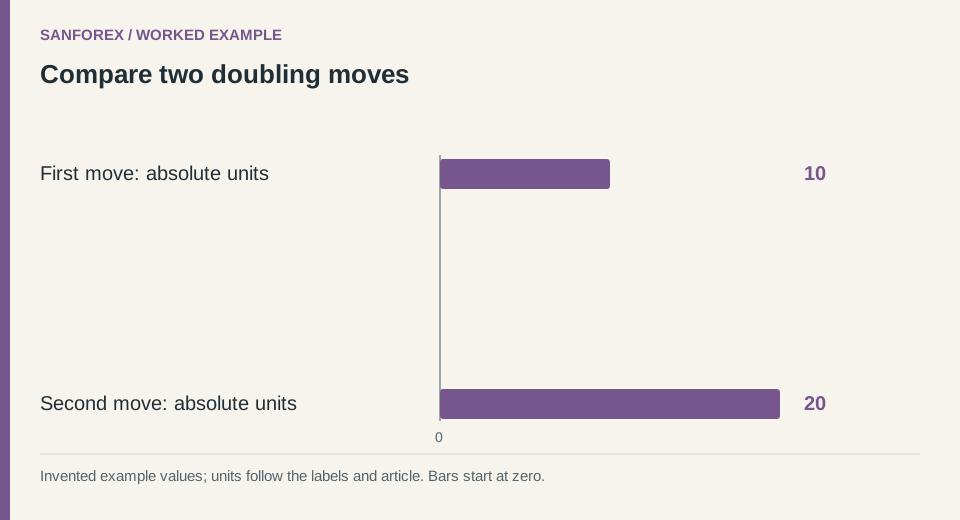
Worked example: First move: absolute units: 10; Second move: absolute units: 20. Invented values; units follow the row labels and article.
Open full-size diagram ↗Keep percentage and cash questions separate
Someone comparing proportional changes may prefer the logarithmic view. Someone checking the absolute distance between entry and exit may need the underlying prices and contract units. Neither visual scale supplies fees, position size or a cash profit calculation. The standard real logarithm also requires positive input values; zero or negative values cannot simply be placed on that scale.
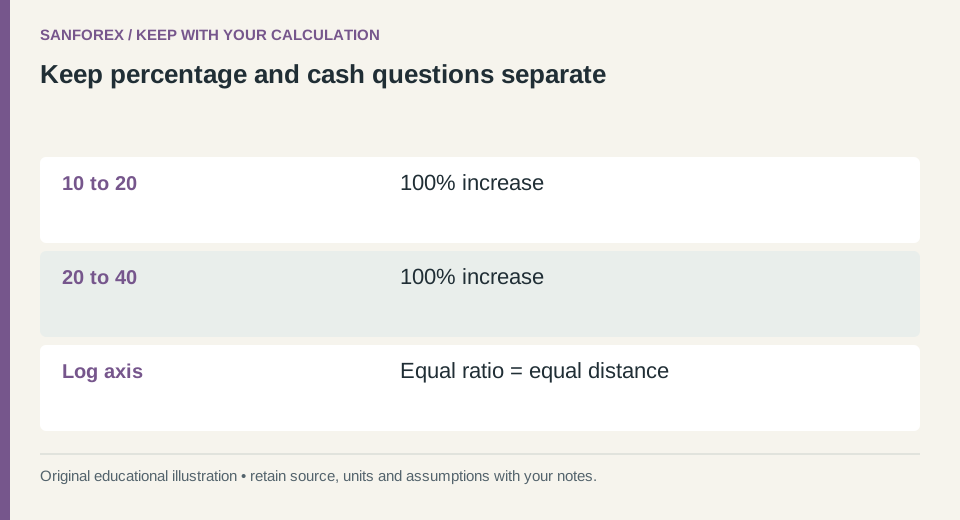
Calculation checklist: 10 to 20: 100% increase; 20 to 40: 100% increase; Log axis: Equal ratio = equal distance. Preserve these definitions when reproducing the example.
Open full-size diagram ↗Write the display settings beside the result
Retain the scale, instrument, interval and visible range with an exported chart. Use the actual numbers to calculate changes rather than estimating percentages from pixels. If an annotated line seems inconsistent after a scale switch, revisit what the annotation was intended to measure. This is a display comparison, not a forecast based on the apparent shape of the line.
Sources and conventions
Examples are hypothetical. Worked examples state their formulas and assumptions in the article; our methodology explains the related calculators. Broker contract specifications determine actual lot, margin and execution conditions. These sources document definitions and data; a source link does not imply endorsement of SanForex or a trading service.
These materials are prepared with AI assistance and checked against worked examples and deterministic calculation tests where applicable. They are not an expert suitability assessment or investment advice.
Open trading journal tool ↗