Why two percentile calculators can return different answers
A percentile summarizes a position within sorted data, but several finite-sample conventions exist.
A percentile needs a calculation convention
A percentile summarizes a position within sorted data, but several finite-sample conventions exist. An exported percentile is incomplete without its method and sample count. To see why, use five invented ordered values: 10, 20, 30, 40 and 100. We will calculate the 80th percentile under two explicitly stated rules, rather than declaring one universal answer.
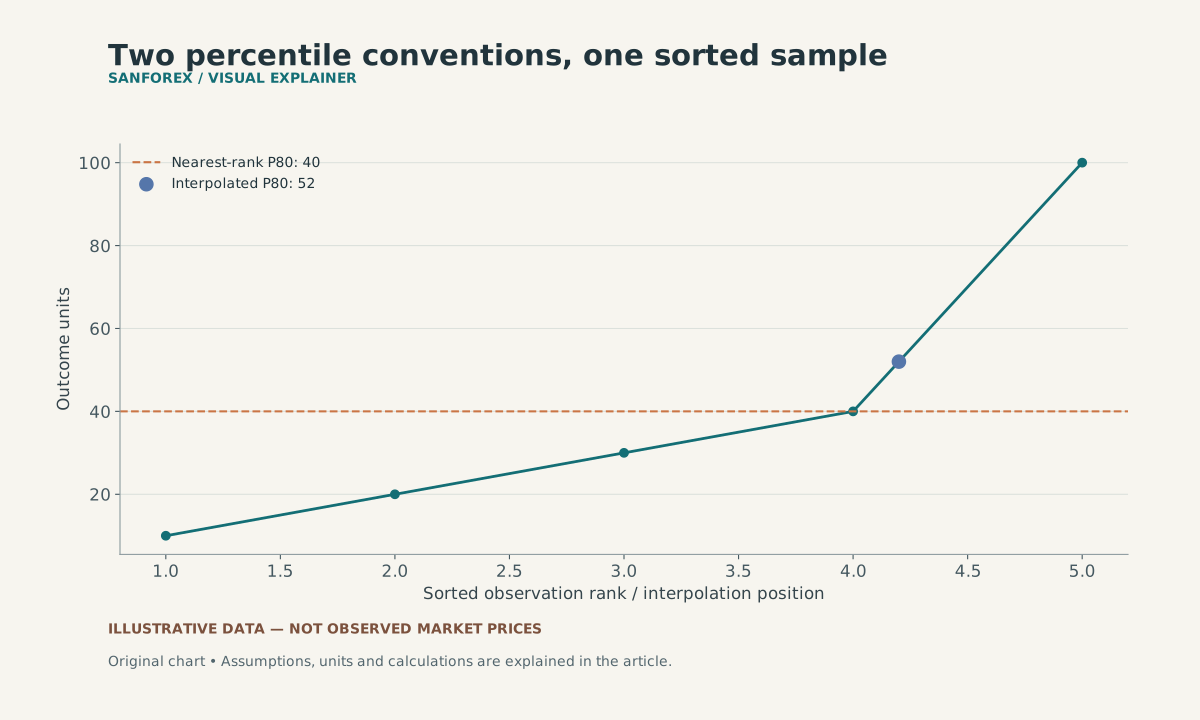
For sorted values 10, 20, 30, 40 and 100, nearest-rank P80 selects rank 4 and value 40. The stated interpolation method uses position 4.2 and value 52. The connecting line explains interpolation, not time.
Open full-size diagram ↗Apply the nearest-rank rule
For this example, nearest rank means rank = ceiling(p × N), using ranks that start at 1. With p = 0.8 and N = 5, the rank is 4 and the answer is 40. This rule selects an actual observation. The endpoint at p = 0 requires a separate convention, so do not extend this formula mechanically to a zero rank.
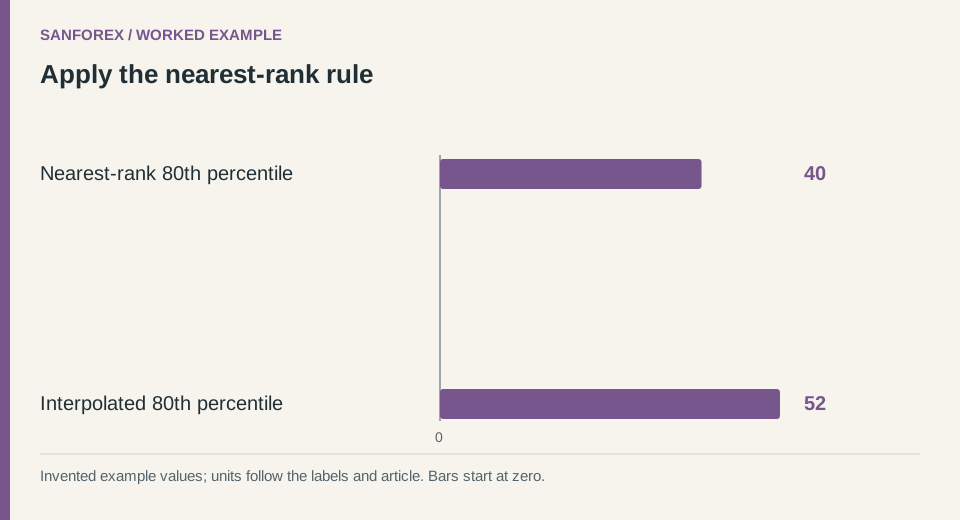
Worked example: Nearest-rank 80th percentile: 40; Interpolated 80th percentile: 52. Invented values; units follow the row labels and article.
Open full-size diagram ↗Compare a linear-interpolation rule
Another convention sets position = 1 + (N - 1) × p. Here the position is 4.2. Interpolating 20% of the way from the fourth value 40 to the fifth value 100 gives 52. The input data and requested percentage are unchanged; the method produces the difference between 40 and 52.
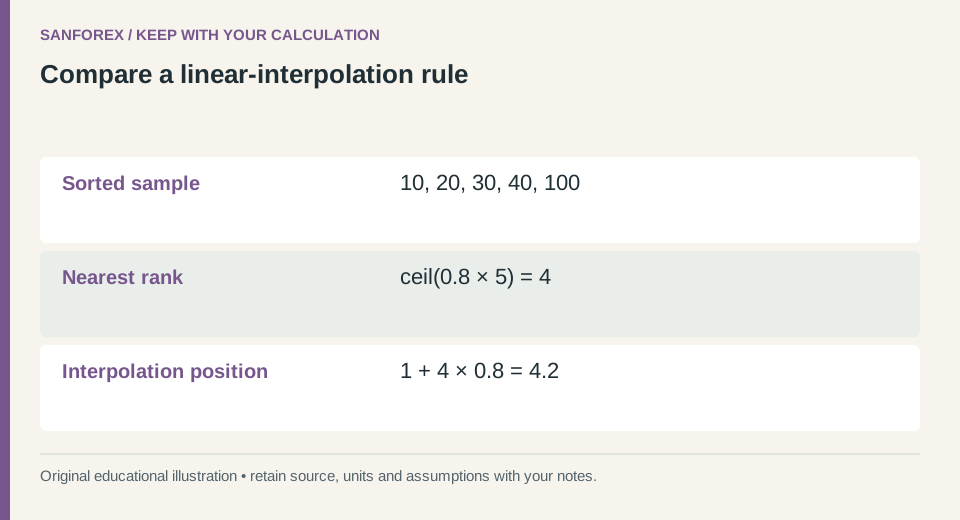
Calculation checklist: Sorted sample: 10, 20, 30, 40, 100; Nearest rank: ceil(0.8 × 5) = 4; Interpolation position: 1 + 4 × 0.8 = 4.2. Preserve these definitions when reproducing the example.
Open full-size diagram ↗Make cross-tool comparisons reproducible
Keep the sorted sample, percentile probability, method and missing-value treatment. A large gap near the tail can magnify method differences in small datasets. Do not interpret an empirical 80th percentile as a guaranteed limit on future losses or durations. If another tool reports a different number, inspect its documented convention before rounding values or changing records to make the outputs agree.
Sources and conventions
Examples are hypothetical. Worked examples state their formulas and assumptions in the article; our methodology explains the related calculators. Broker contract specifications determine actual lot, margin and execution conditions. These sources document definitions and data; a source link does not imply endorsement of SanForex or a trading service.
These materials are prepared with AI assistance and checked against worked examples and deterministic calculation tests where applicable. They are not an expert suitability assessment or investment advice.
Open trading journal tool ↗