Read OHLC candles without inventing the price path
Use a worked candle to distinguish body, range and missing intrabar information before drawing conclusions.
Start with the four observations
A conventional candlestick summarizes the open, high, low and close for a chosen interval. Its body connects the open and close; the wick or shadow extends to the high and low. Platform colors are configurable, so verify the legend instead of assuming that a particular color always means an upward move. These are historical observations within a data series. A candle does not, by itself, specify an order, a probability of profit or a forecast.
Calculate a hypothetical candle
Take a hypothetical EUR/USD candle with open 1.1000, high 1.1030, low 1.0990 and close 1.1020. Its total high–low range is 0.0040, or 40 conventional pips. The open-to-close body is 20 pips. The upper wick is 10 pips and the lower wick is 10 pips. Adding the two wicks and the body gives the 40-pip range. This is a useful consistency check when learning to read the visual, not evidence that the next candle will continue in the same direction.
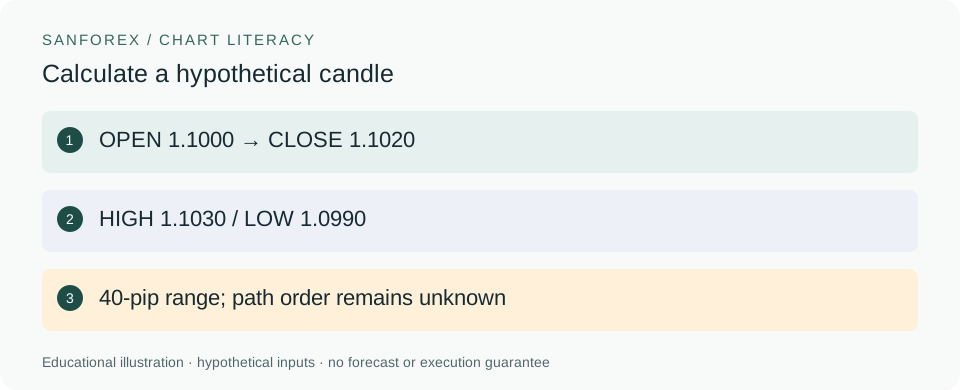
Hypothetical example: OPEN 1.1000 → CLOSE 1.1020. HIGH 1.1030 / LOW 1.0990. 40-pip range; path order remains unknown.
Open full-size diagram ↗Notice what the candle cannot tell you
Two different paths can produce those same four numbers. One might move from the open to the low, then the high, and finally the close. Another might visit the high before the low. If a hypothetical stop and target both lie inside the candle’s range, OHLC alone does not establish which was reached first. That missing sequence matters when reviewing a simulated trade. Use sufficiently detailed evidence or explicitly report that the outcome cannot be resolved from the chosen bar.
Match the data before comparing charts
Write down the complete symbol, provider, interval, time zone and whether the bar is complete. Also identify whether prices represent transactions, bids, asks or another series. An unfinished candle can change before its interval ends. Different feeds and interval boundaries need not yield identical bars, especially in decentralized markets. A screenshot without these labels is a weak audit record. Changing the visible time zone is not the same thing as obtaining a new underlying price feed.
Build a repeatable observation exercise
Choose a completed historical candle, record its four values, calculate its range and body, and then compare your arithmetic with the picture. Keep any trade simulation separate: quantities, actual entry and exit assumptions, costs and account-currency conversion belong in a different calculation. Avoid assigning a guaranteed direction to a candle name or shape. The objective is to describe the data accurately and identify what remains unknown before evaluating any strategy claim.
Sources and conventions
Examples are hypothetical. Worked examples state their formulas and assumptions in the article; our methodology explains the related calculators. Broker contract specifications determine actual lot, margin and execution conditions. These sources document definitions and data; a source link does not imply endorsement of SanForex or a trading service.
These materials are prepared with AI assistance and checked against worked examples and deterministic calculation tests where applicable. They are not an expert suitability assessment or investment advice.
Open profit & loss tool ↗