RSI: inspect average gains and losses before reading the number
A hypothetical RSI formula checkpoint showing how supplied smoothed gains and losses determine the final reading.
Separate price changes from the final oscillator
RSI uses smoothed gains and losses to form a relative strength ratio, then converts that ratio to a bounded oscillator reading. The supplied official-source evidence describes the formula and an RMA smoothing example. The RSI value is not a price change or a fraction of trades that will succeed. This guide checks the final formula from already-smoothed inputs; it does not rebuild the smoothing history.
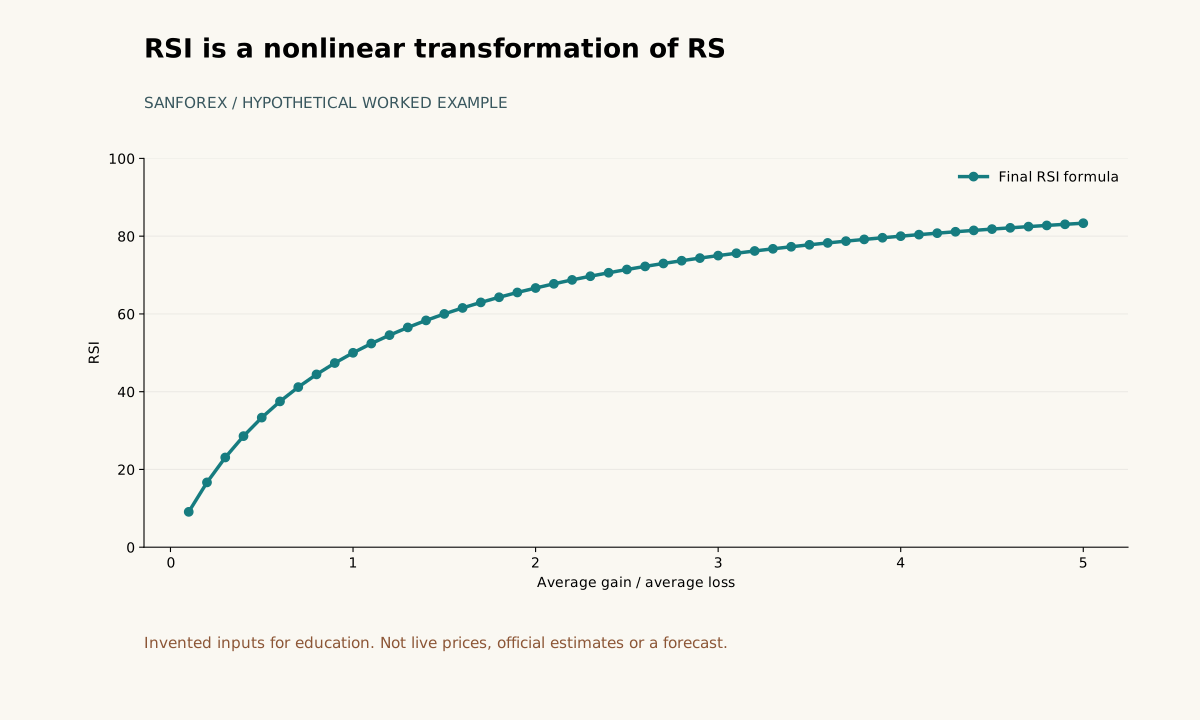
Formula checkpoint for positive loss magnitudes. This does not construct a complete historical RSI line.
Open full-size diagram ↗A hypothetical worked example
For a hypothetical RSI formula checkpoint, suppose the already-smoothed average gain is 2 and the already-smoothed average loss magnitude is 1. RS is 2 / 1 = 2 and RSI is 100 - 100 / (1 + 2), or about 66.6667. If those inputs are 1 and 2, RSI is about 33.3333. These supplied averages illustrate the final formula only; they do not reconstruct a full 14-period indicator from two price changes.
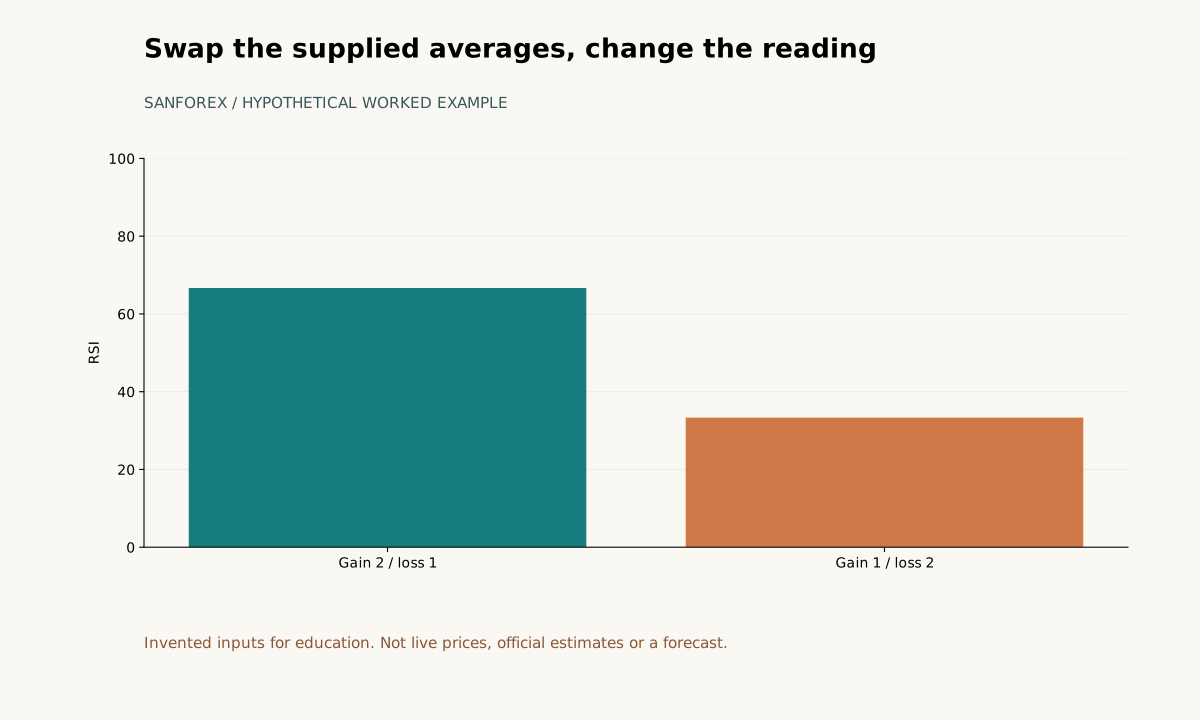
Already-smoothed averages 2 and 1 produce RSI 66.6667; 1 and 2 produce RSI 33.3333.
Open full-size diagram ↗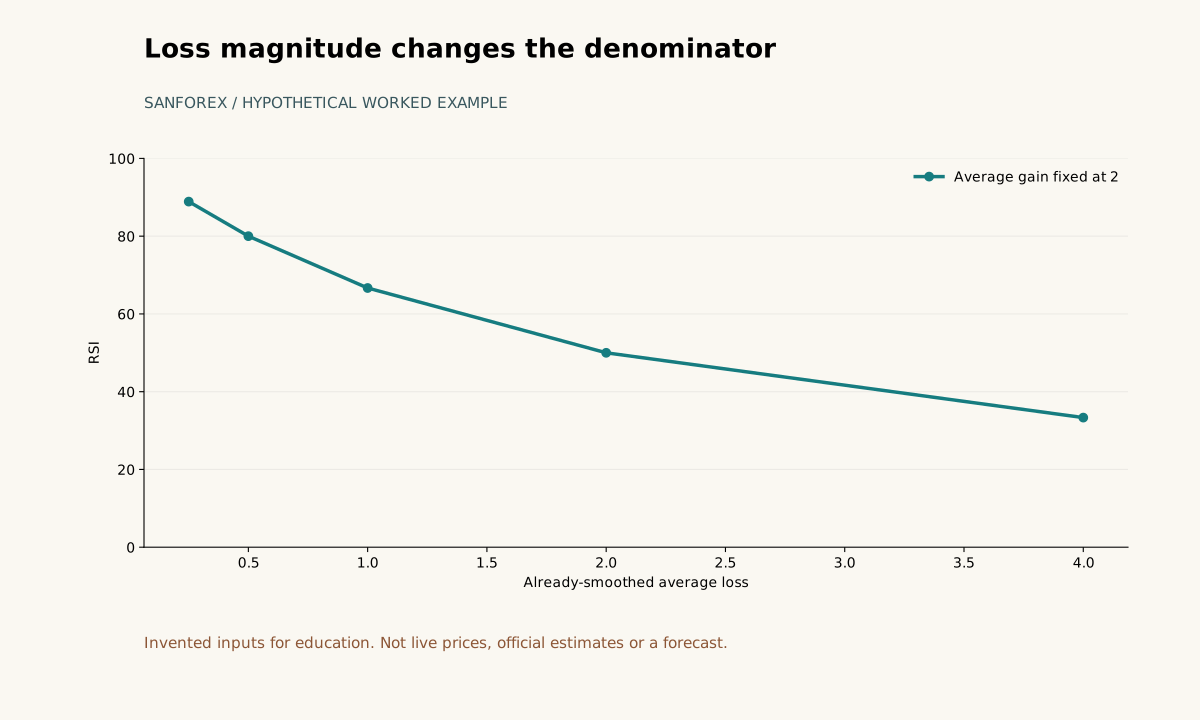
Separate hypothetical sensitivity: average gain stays 2; average loss varies. All inputs are positive.
Open full-size diagram ↗Audit the supplied averages
Keep average gain and average loss magnitude as separate inputs. Here both losses are positive magnitudes. Reproduce the result in two steps: divide gain by loss to get RS, then calculate 100 - 100 / (1 + RS). A hypothetical check with gain 2 and loss 1 gives RS 2 and RSI 66.666667 to six decimal places. Reversing the inputs gives RS 0.5 and RSI 33.333333. Do not average these two readings to represent a combined period; that would not reproduce the underlying smoothing history.
Settings and history affect comparisons
A full RSI reconstruction needs the price observations, lookback length, smoothing convention, initialization rule, and enough preceding history. Record those details and the chart timeframe when comparing readings. A short truncated series can start from different smoothed values than a longer series. This checkpoint starts after smoothing and does not establish equivalence with a platform’s complete historical line.
Keep interpretation within the calculation
A reading describes the relationship between the smoothed gain and loss inputs used in the formula. It does not predict the next price or set a deadline for reversal. The supplied evidence does not establish platform behavior when average loss is zero, so this example makes no claim about that edge case. Treat the figures as educational arithmetic, not a recommendation or performance promise.
Know what the related tool does
The related SanForex trading journal records and reviews trade results; it does not calculate RSI or connect to a broker. No RSI calculator behavior is claimed here. You can independently check this hypothetical example with the displayed formula, keeping the supplied smoothed averages distinct from any price series or journal statistics.
Sources and conventions
Examples are hypothetical. Worked examples state their formulas and assumptions in the article; our methodology explains the related calculators. Broker contract specifications determine actual lot, margin and execution conditions. These sources document definitions and data; a source link does not imply endorsement of SanForex or a trading service.
These materials are prepared with AI assistance and checked against worked examples and deterministic calculation tests where applicable. They are not an expert suitability assessment or investment advice.
Open trading journal tool ↗