Sample and population standard deviation: why the denominator matters
A standard deviation describes dispersion around a mean using squared deviations.
Name the quantity being summarized
A standard deviation describes dispersion around a mean using squared deviations. Two common formulas differ in their denominator: the population version divides the sum of squared deviations by N, while the sample version uses N minus 1. A spreadsheet result cannot be checked properly until you know which definition was selected and which rows were included.
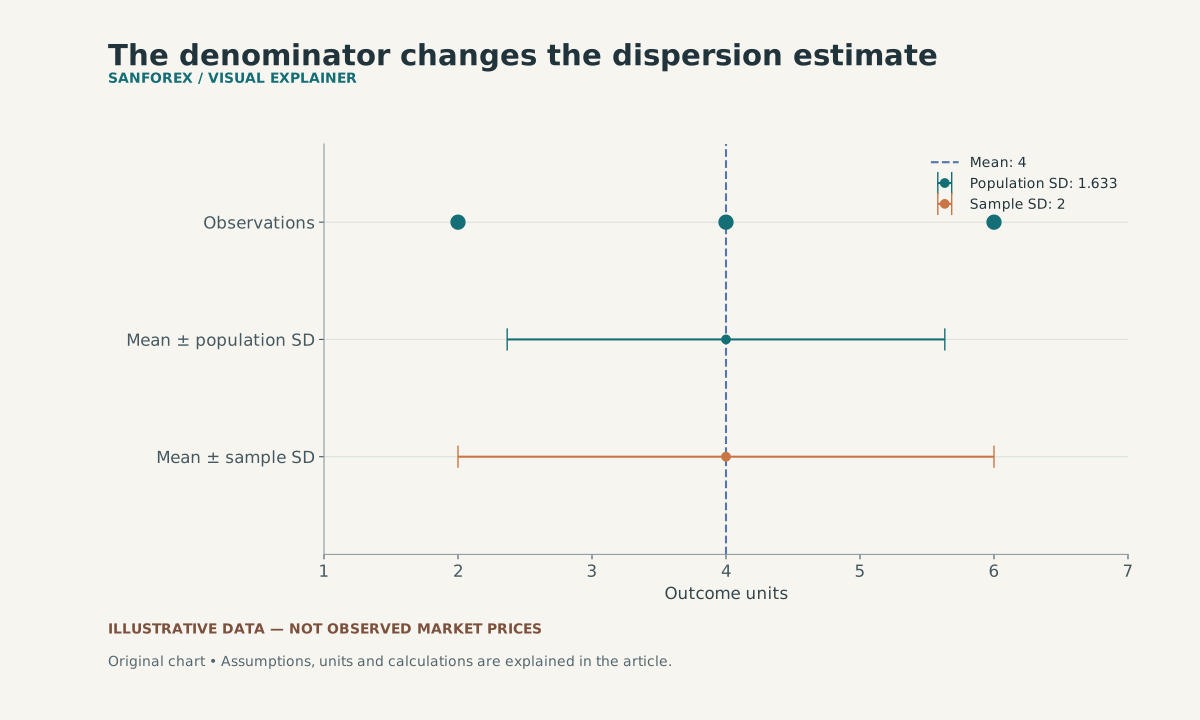
Outcomes 2, 4 and 6 have mean 4. The two horizontal spans show one population standard deviation (about 1.633) and one sample standard deviation (2) on either side, not confidence intervals.
Open full-size diagram ↗Work through three invented outcomes
Take outcomes of 2, 4 and 6 units. Their mean is 4. Deviations are minus 2, zero and plus 2, whose squares total 8. Population variance is 8 / 3 and population standard deviation is approximately 1.633. Sample variance is 8 / 2 = 4 and sample standard deviation is 2.
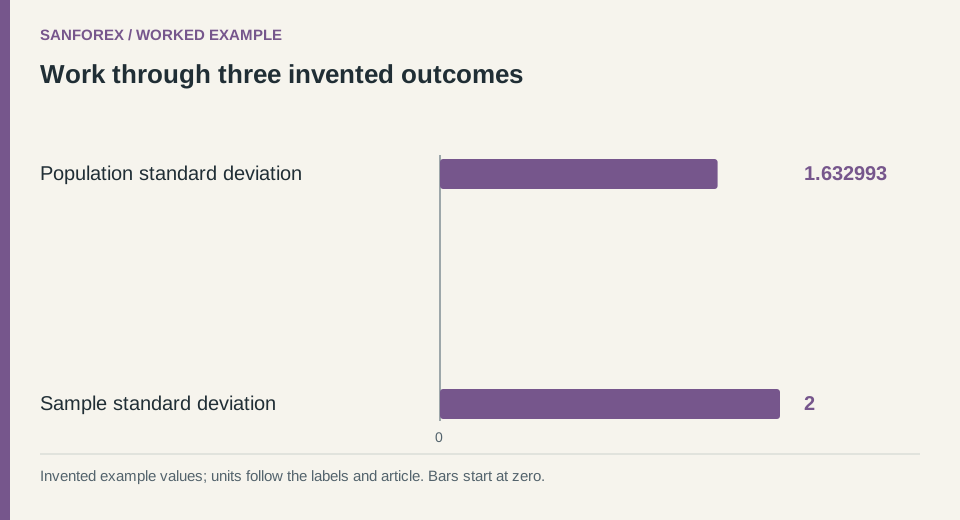
Worked example: Population standard deviation: 1.63299; Sample standard deviation: 2. Invented values; units follow the row labels and article.
Open full-size diagram ↗Do not confuse variance with standard deviation
Variance is expressed in squared units; standard deviation returns to the original unit after taking the square root. For a one-observation dataset, the sample denominator is zero, so the usual sample standard deviation is undefined. Entering zero would falsely suggest that dispersion has been meaningfully estimated.
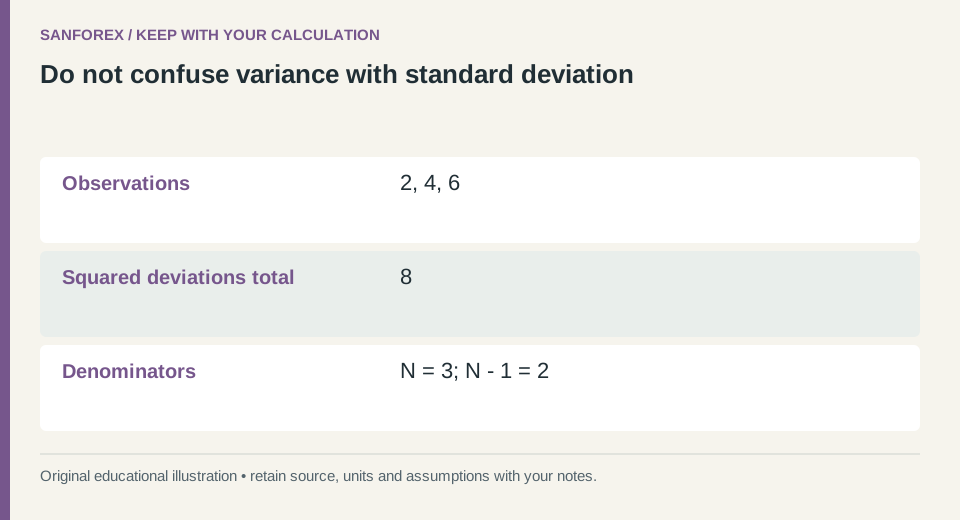
Calculation checklist: Observations: 2, 4, 6; Squared deviations total: 8; Denominators: N = 3; N - 1 = 2. Preserve these definitions when reproducing the example.
Open full-size diagram ↗Keep interpretation within the evidence
Record the formula, row count, units and missing-value policy. A cash-outcome deviation can change with position size and should not be casually compared with a percentage-return deviation. These three invented numbers demonstrate calculation only. A sample estimate is not a guaranteed future range, and no normal-distribution probability claim follows merely from calculating a mean and standard deviation.
Sources and conventions
Examples are hypothetical. Worked examples state their formulas and assumptions in the article; our methodology explains the related calculators. Broker contract specifications determine actual lot, margin and execution conditions. These sources document definitions and data; a source link does not imply endorsement of SanForex or a trading service.
These materials are prepared with AI assistance and checked against worked examples and deterministic calculation tests where applicable. They are not an expert suitability assessment or investment advice.
Open trading journal tool ↗