Stock splits: reconcile share count, price and chart history
Use share count and price together to understand a stock split and compare chart history on a consistent basis.
A split changes the share basis
A stock split changes the number of shares represented by each holding. Investor.gov’s two-for-one example doubles the share count without changing shareholders’ equity by the split itself. The quoted price is mechanically adjusted to match the new share basis. Compare prices across the event only after checking how the chart or data source treats that corporate action.
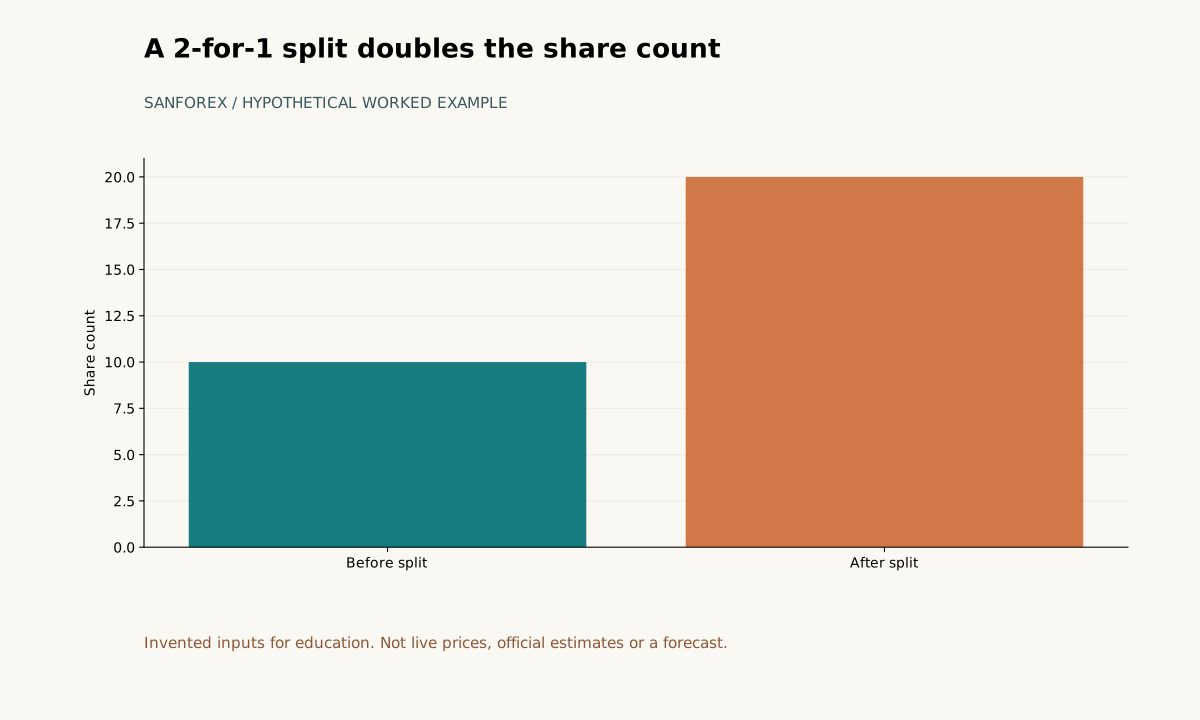
Invented holding: 10 shares become 20. The split alone does not double position value.
Open full-size diagram ↗A hypothetical worked example
In a hypothetical 2-for-1 split, 10 shares at a pre-split price of 120 become 20 shares at a mechanically adjusted price of 60. The position value is 1200 on either side before other market moves. Comparing the raw prices alone would show -50%; comparing 120 with an actual post-split price of 63 after adjusting the old price to 60 gives +5%. The 63 scenario is invented and not an actual corporate action.
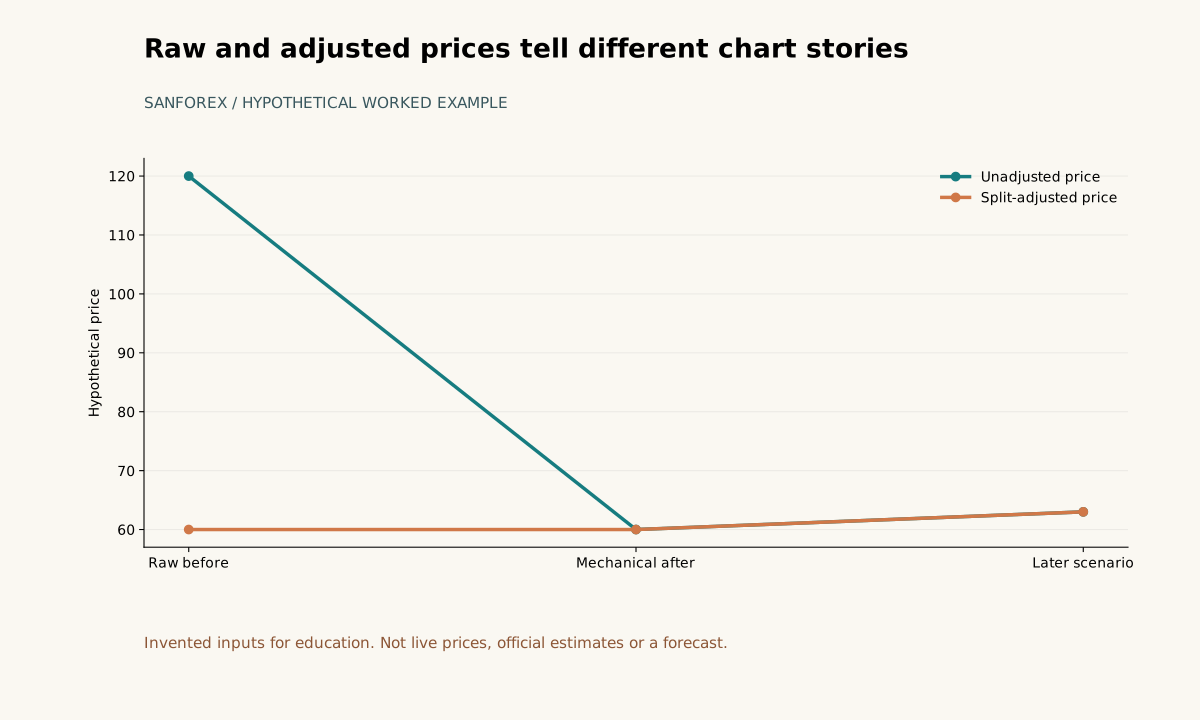
Mechanical price 120 to 60; an additional invented price 63 is 5% above adjusted 60.
Open full-size diagram ↗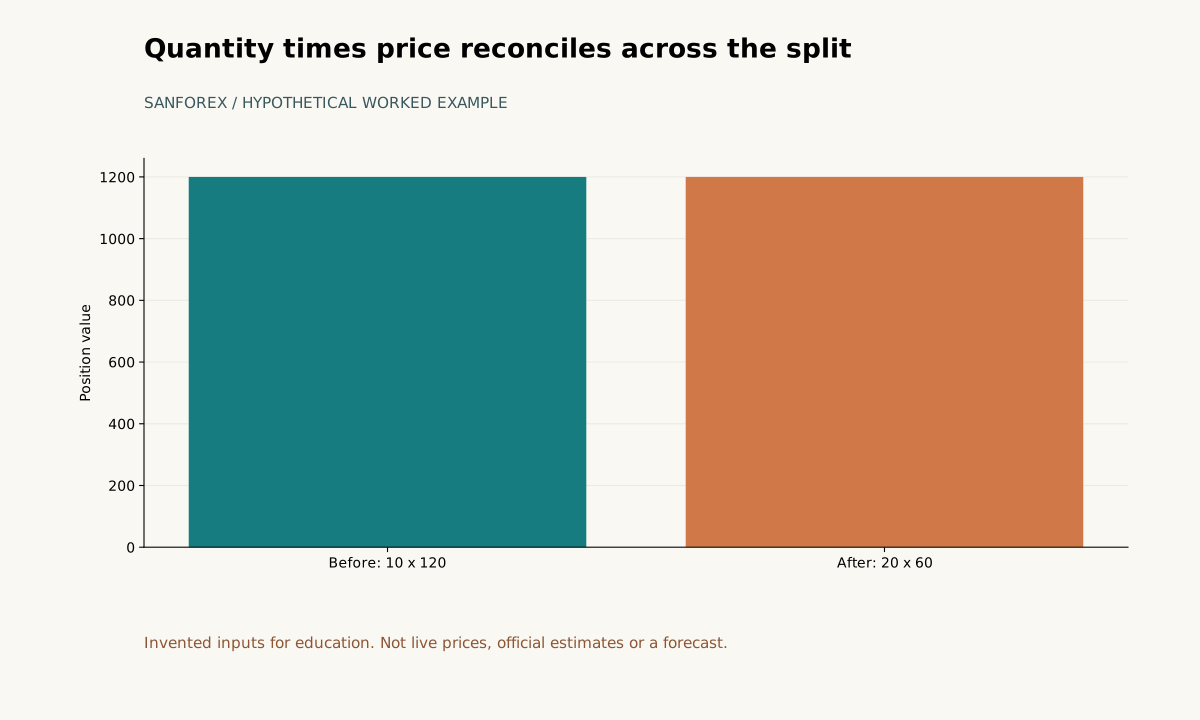
Both sides equal 1200 before other market moves. Fractional shares, taxes and distributions omitted.
Open full-size diagram ↗Reproduce the arithmetic
Before the split: 10 × 120 = 1,200. After a 2-for-1 split: 10 × 2 = 20 shares, and 120 ÷ 2 = 60 per share; 20 × 60 = 1,200. For the separate invented 63 scenario, compare 63 with adjusted 60: (63 ÷ 60 − 1) × 100 = 5%. The 120-to-63 raw comparison mixes share bases and does not isolate a price move.
Read raw and adjusted history carefully
A raw series keeps the original quoted prices; an adjusted series may restate earlier prices to a common share basis. Check the provider’s adjustment method and keep labels consistent when comparing fields. A split adjustment alone is not a total-return measure. No specific provider behavior is assumed here.
What the related tool does
SanForex’s trading journal is for recording and reviewing trade records; it does not retrieve corporate actions or adjust stock charts. The arithmetic above is an educational calculation you can reproduce separately. It is not a displayed result from that tool, and the invented 63 scenario is not market data.
Sources and conventions
Examples are hypothetical. Worked examples state their formulas and assumptions in the article; our methodology explains the related calculators. Broker contract specifications determine actual lot, margin and execution conditions. These sources document definitions and data; a source link does not imply endorsement of SanForex or a trading service.
These materials are prepared with AI assistance and checked against worked examples and deterministic calculation tests where applicable. They are not an expert suitability assessment or investment advice.
Open trading journal tool ↗