VWAP: follow cumulative volume and the reset point
A hypothetical VWAP example shows how cumulative volume weights prices and how a new anchor resets the calculation.
What VWAP averages
VWAP is a volume-weighted average over an accumulation period: add each selected price multiplied by its volume, then divide by accumulated volume. The referenced TradingView explanation describes a typical-price calculation and configurable price source and anchor. For a chart comparison, note the symbol, feed, timeframe, price source and anchor because changing inputs can change the displayed line.
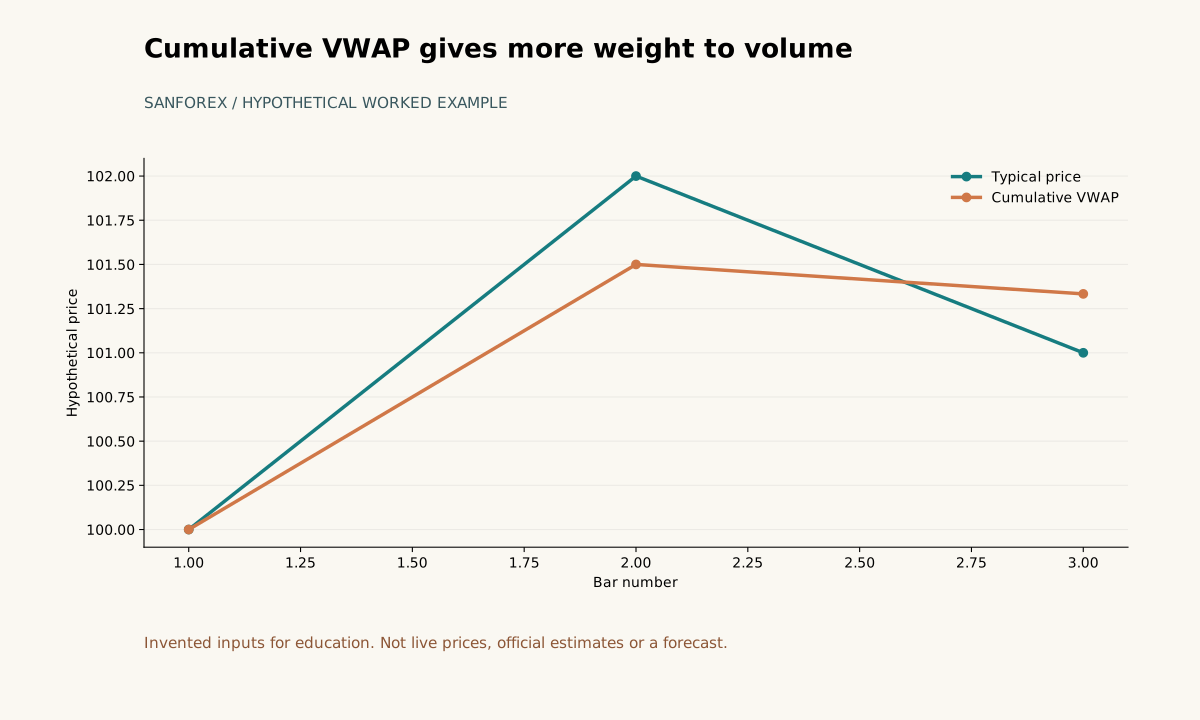
Prices 100, 102, 101; volumes 10, 30, 20; final cumulative VWAP 101.3333.
Open full-size diagram ↗A hypothetical worked example
Three hypothetical bars have HLC3 typical prices of 100, 102 and 101 with volumes of 10, 30 and 20. Cumulative price-volume totals are 1000, 4060 and 6080; cumulative volumes are 10, 40 and 60. VWAP is therefore 100, 101.5 and about 101.3333. The unweighted mean after three bars is 101. A new anchor would reset both cumulative totals; it would not carry 6080 and 60 into the new period.
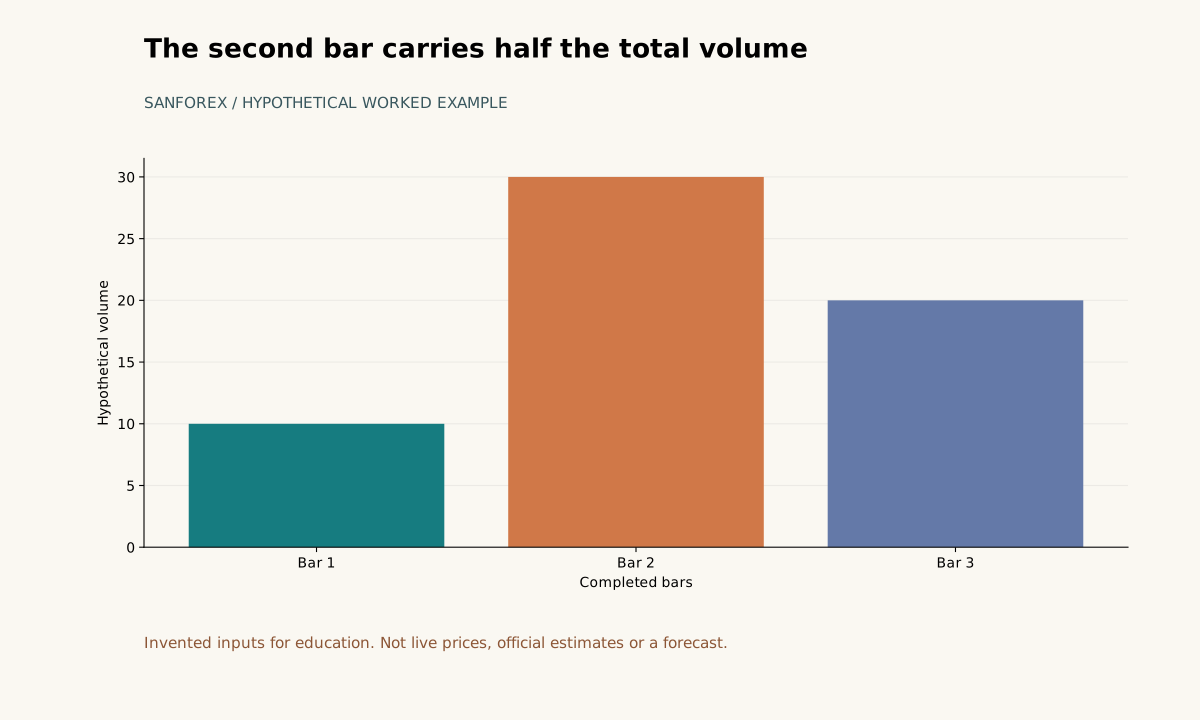
Three volumes sum to 60. The second bar contributes 30, or half of that total.
Open full-size diagram ↗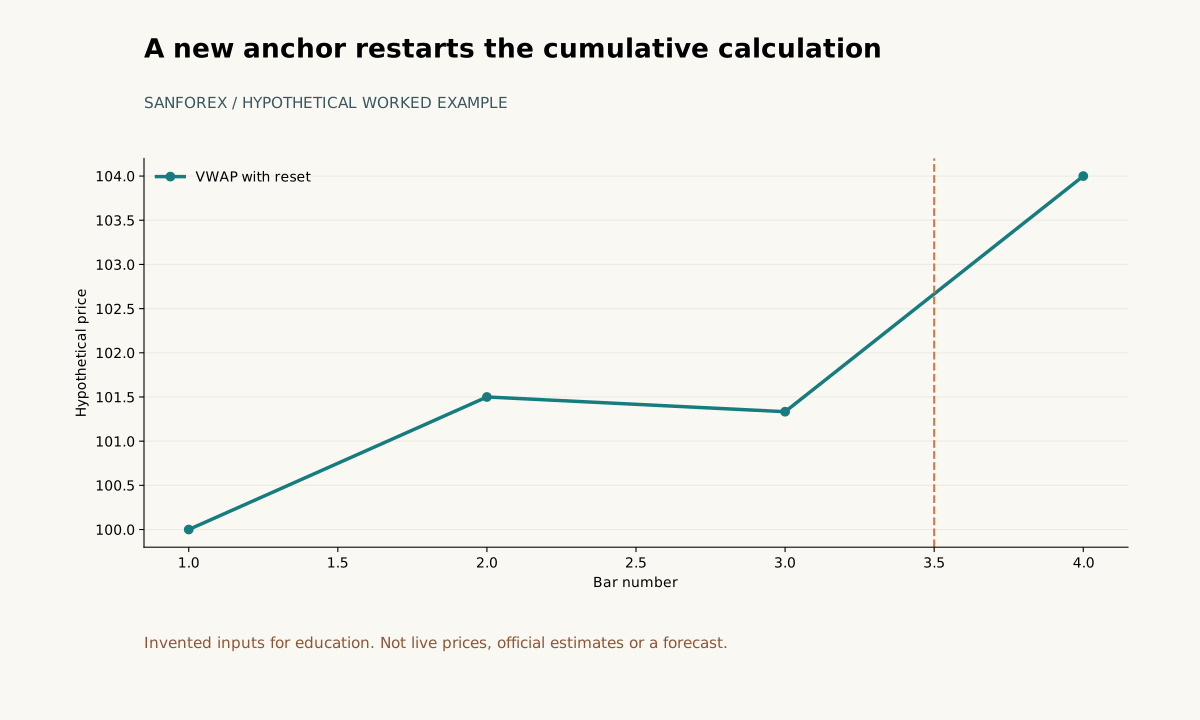
Additional invented bar has price 104 and volume 10. Reset before bar 4 makes new-anchor VWAP 104.
Open full-size diagram ↗Reproduce each bar
For each bar, multiply its selected price by its volume and add that product to the prior price-volume total. Separately add its volume to the prior volume total, then divide the first running total by the second. Here the second bar has three times the volume of the first, so it has more weight. The plain mean of 100, 102 and 101 is 101 and does not use volume.
Check the reset point
At a new anchor, restart both running totals on the first included bar. Keeping an old volume total while restarting the price-volume total mixes two periods. A session anchor and a weekly anchor include different bars, so comparisons need the same reset rule and timeframe.
Handle the denominator and interpretation
If accumulated volume is zero, division has no valid result; do not invent a denominator. Missing volume should be checked against the data feed. A line above or below price summarizes the selected past inputs and does not establish what a later bar will do. The example is hypothetical, not market data or a performance test.
Record a comparison
To review a displayed chart, record its symbol, timeframe, price source, anchor and feed, then compare those settings before comparing values. The related trading journal can hold review notes; the available SanForex material does not show a VWAP calculator or live VWAP display.
Sources and conventions
Examples are hypothetical. Worked examples state their formulas and assumptions in the article; our methodology explains the related calculators. Broker contract specifications determine actual lot, margin and execution conditions. These sources document definitions and data; a source link does not imply endorsement of SanForex or a trading service.
These materials are prepared with AI assistance and checked against worked examples and deterministic calculation tests where applicable. They are not an expert suitability assessment or investment advice.
Open trading journal tool ↗