Allocation weights: do not mix notional, margin and risk budgets
A percentage allocation needs a common denominator.
Choose one measurement basis
A percentage allocation needs a common denominator. Notional exposure, posted margin and a planned stop-loss budget describe different quantities. Adding percentages derived from different bases produces a number without a coherent meaning. This worksheet explains labels; it does not recommend an allocation or level of leverage.
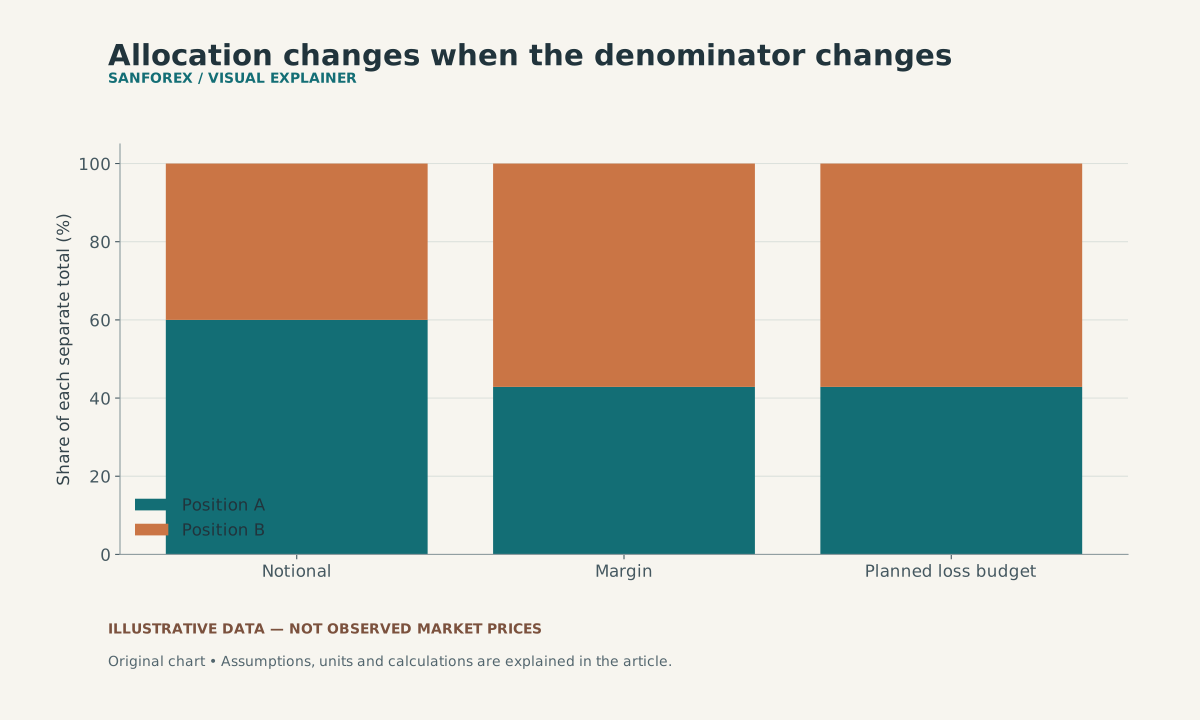
Position A is 60% of total notional but about 42.86% of modeled margin and planned loss budget. Each stacked bar has its own denominator; these are not interchangeable measures of risk.
Open full-size diagram ↗Reconcile a hypothetical notional split
Suppose two exposures have notionals of 6,000 and 4,000 in the same currency. Their shares of total notional are 60% and 40%. If their modeled margin amounts are 300 and 400, their shares of combined margin are approximately 42.86% and 57.14%. The notional weights and margin weights differ because the margin assumptions differ.
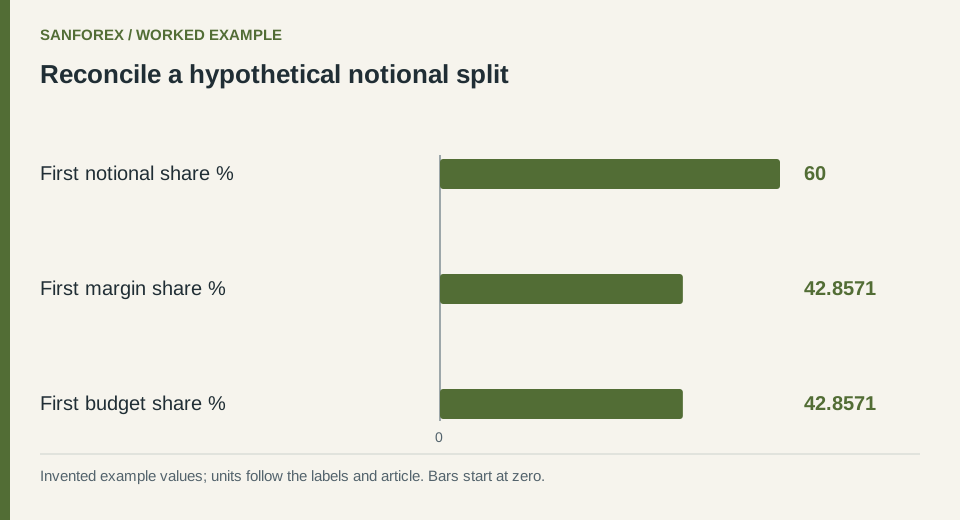
Worked example: First notional share %: 60; First margin share %: 42.8571; First budget share %: 42.8571. Invented values; units follow the row labels and article.
Open full-size diagram ↗Keep a risk budget on another line
If planned price-loss budgets are 60 and 80, they total 140 under the stated assumptions. Those budgets are not established by the notional weights alone. Costs, price gaps and changing conversion rates can alter realized losses. A 60% notional weight is not a statement that the position causes 60% of every possible portfolio loss.
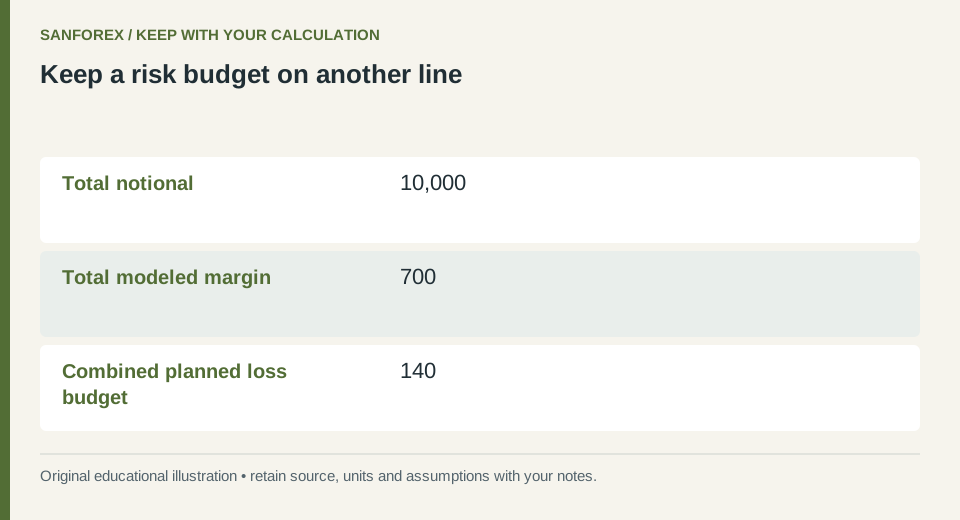
Calculation checklist: Total notional: 10,000; Total modeled margin: 700; Combined planned loss budget: 140. Preserve these definitions when reproducing the example.
Open full-size diagram ↗Check a table before making a pie chart
Each column should name its currency, unit, valuation time and denominator. Confirm that weights within one column sum to 100%, while leaving other columns separate. SanForex estimates individual initial-margin arithmetic under supplied inputs; it does not calculate portfolio margin offsets or a comprehensive risk allocation.
Sources and conventions
Examples are hypothetical. Worked examples state their formulas and assumptions in the article; our methodology explains the related calculators. Broker contract specifications determine actual lot, margin and execution conditions. These sources document definitions and data; a source link does not imply endorsement of SanForex or a trading service.
These materials are prepared with AI assistance and checked against worked examples and deterministic calculation tests where applicable. They are not an expert suitability assessment or investment advice.
Open margin tool ↗