Repeated percentage losses: a fixed-fraction worksheet
Repeatedly losing a fixed percentage of the remaining balance is different from losing the same cash amount each time.
A percentage can refer to a changing base
Repeatedly losing a fixed percentage of the remaining balance is different from losing the same cash amount each time. The former is multiplicative. This article is an arithmetic stress scenario, not a recommended risk fraction or a claim that stop orders reliably limit losses to a chosen percentage.
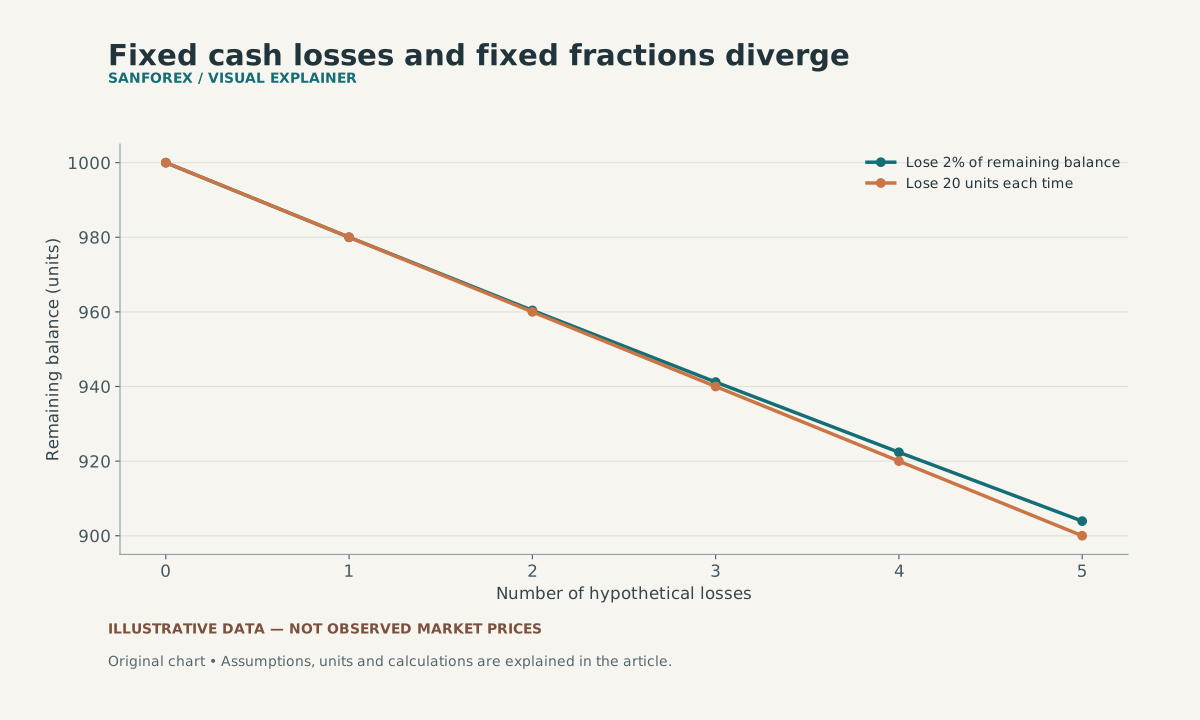
Five exact 2% losses leave about 903.92 from 1,000, while five fixed 20-unit losses leave 900. These are arithmetic assumptions, not guarantees about stop execution or streak probabilities.
Open full-size diagram ↗Calculate five invented losses
Start at 1,000 units and assume each loss is exactly 2% of the then-current balance. The balances after the first three losses are 980, 960.40 and 941.192. After five, the balance is 1,000 × 0.98 to the fifth power = 903.9207968. The cumulative decline is about 9.6079%, rather than exactly 10%. Keep precision internally and round only the reported balance.
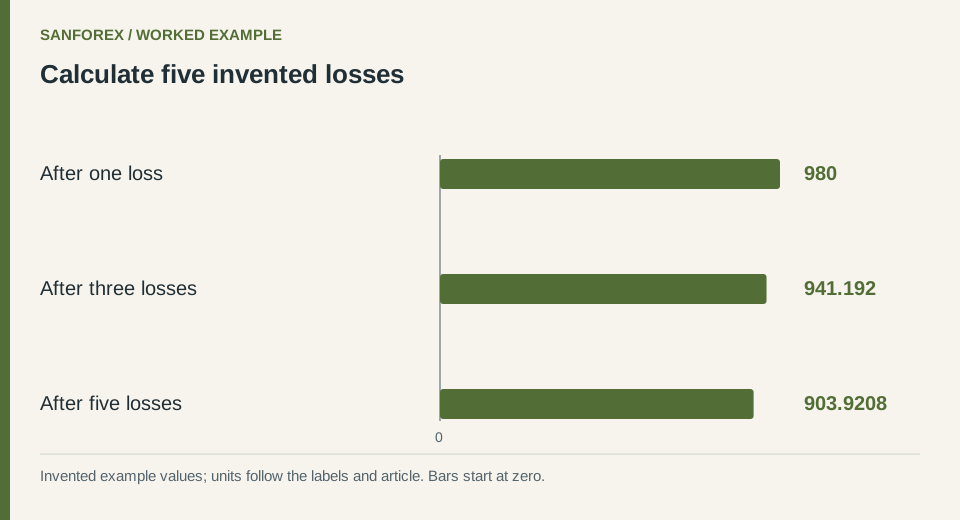
Worked example: After one loss: 980; After three losses: 941.192; After five losses: 903.921. Invented values; units follow the row labels and article.
Open full-size diagram ↗Contrast a fixed cash loss
Five losses of 20 units each would instead leave 900. The first loss matches the percentage model, but later losses do not, because the percentage model uses a shrinking base. Fees, minimum quantities and price gaps can make actual outcomes depart from either simple model.
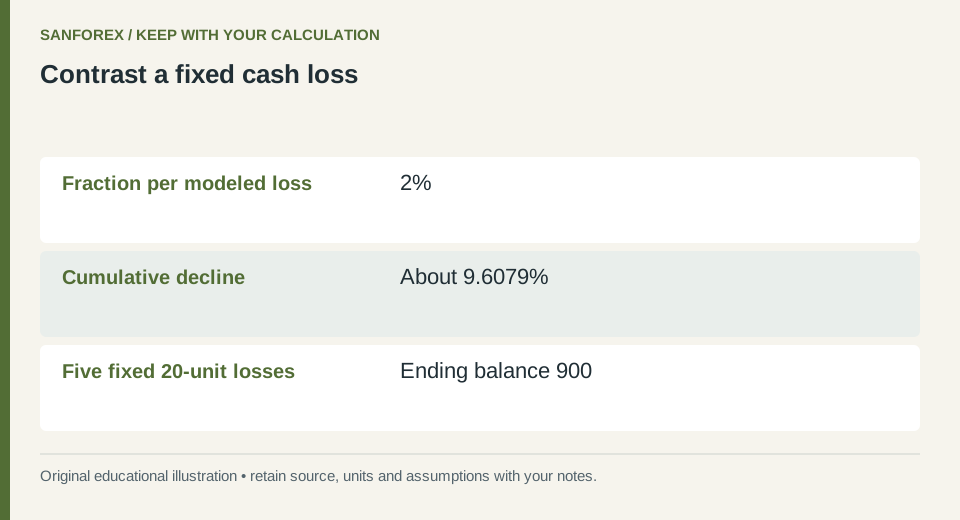
Calculation checklist: Fraction per modeled loss: 2%; Cumulative decline: About 9.6079%; Five fixed 20-unit losses: Ending balance 900. Preserve these definitions when reproducing the example.
Open full-size diagram ↗Use the worksheet to expose assumptions
Record whether the fraction applies to balance, equity or another base and when the base is measured. A modeled streak does not estimate its probability or establish safety. SanForex’s recovery calculator can show the gain required after a stated percentage decline, but it does not estimate streak probabilities or enforce execution losses.
Sources and conventions
Examples are hypothetical. Worked examples state their formulas and assumptions in the article; our methodology explains the related calculators. Broker contract specifications determine actual lot, margin and execution conditions. These sources document definitions and data; a source link does not imply endorsement of SanForex or a trading service.
These materials are prepared with AI assistance and checked against worked examples and deterministic calculation tests where applicable. They are not an expert suitability assessment or investment advice.
Open drawdown recovery tool ↗