Expected value is a model, not a promised trade outcome
A mathematical expected value combines outcomes with probabilities.
Distinguish an assumed probability from a measured frequency
A mathematical expected value combines outcomes with probabilities. A historical winning percentage is an observation from a particular sample, not automatically the true probability of the next outcome. Keep assumed probabilities, sample frequencies and actual cash results in separate fields.
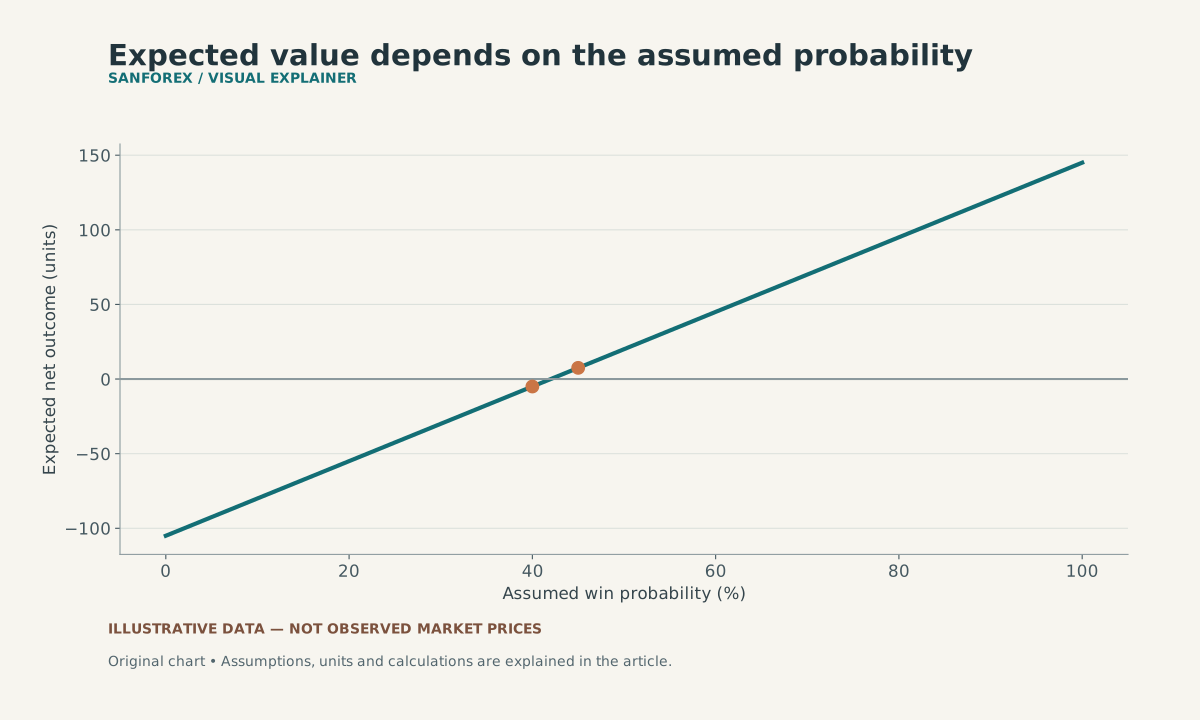
For gross outcomes of +150 or -100 and a five-unit cost every time, modeled net expected value is 250p - 105. Markers show -5 at p = 40% and +7.5 at p = 45%; probabilities are assumed.
Open full-size diagram ↗Calculate an explicit hypothetical model
Assume a model with a 40% probability of gaining 150 units and a 60% probability of losing 100. Its expected value is 0.40 × 150 − 0.60 × 100 = zero before costs. If every modeled outcome incurs five units of cost, the expected net value becomes −5. No individual outcome equals that average: the modeled net possibilities are +145 and −105.
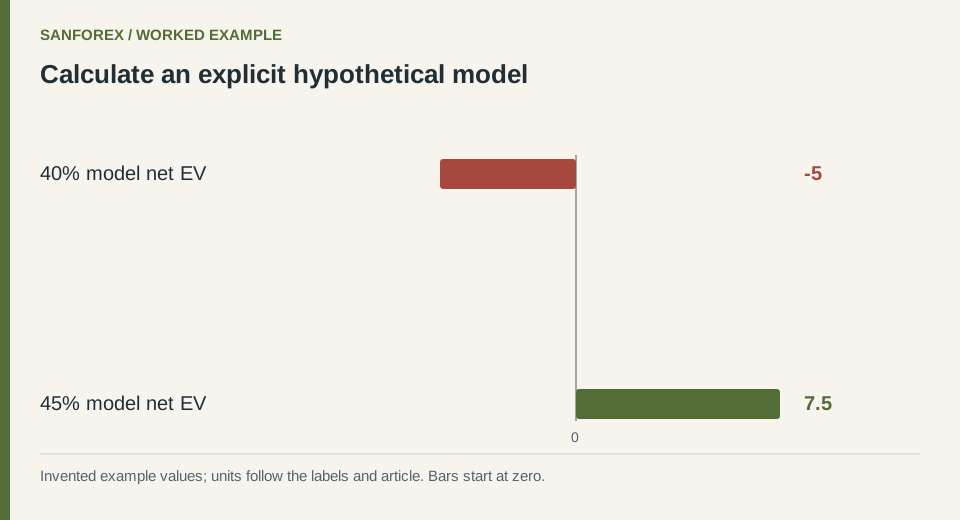
Worked example: 40% model net EV: -5; 45% model net EV: 7.5. Invented values; units follow the row labels and article.
Open full-size diagram ↗Test sensitivity rather than claiming certainty
If the assumed winning probability changes to 45% while the gross outcomes remain unchanged, gross expected value becomes 12.50 and net expected value becomes 7.50. That sensitivity demonstrates how much the answer depends on the probability assumption. It does not establish that 45% is realistic or that a positive expected value prevents a run of losses.
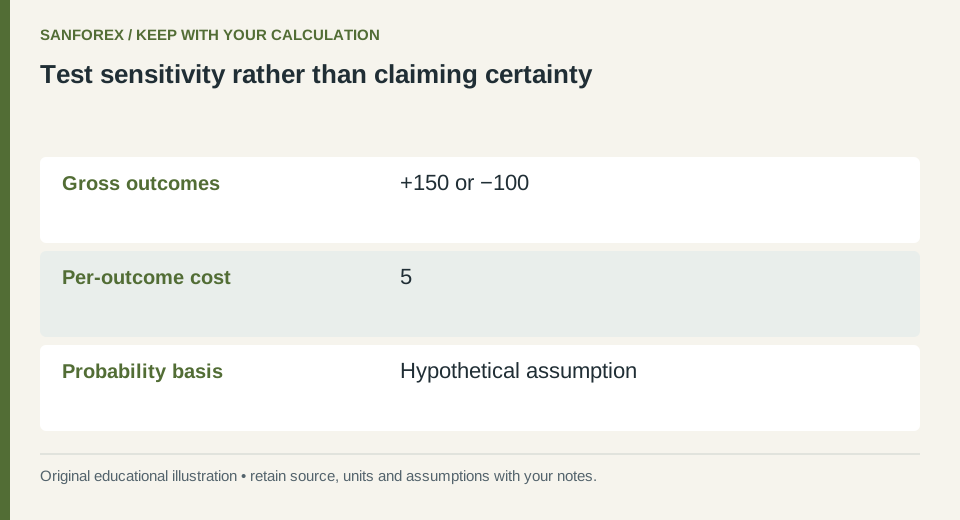
Calculation checklist: Gross outcomes: +150 or −100; Per-outcome cost: 5; Probability basis: Hypothetical assumption. Preserve these definitions when reproducing the example.
Open full-size diagram ↗Record where the assumptions came from
List outcome definitions, probability basis, costs and the period or process being modeled. If probabilities are unknown, call the calculation a scenario rather than an estimate. SanForex’s risk/reward calculator derives a theoretical break-even rate from stated distances; it does not measure the probability of reaching a target.
Sources and conventions
Examples are hypothetical. Worked examples state their formulas and assumptions in the article; our methodology explains the related calculators. Broker contract specifications determine actual lot, margin and execution conditions. These sources document definitions and data; a source link does not imply endorsement of SanForex or a trading service.
These materials are prepared with AI assistance and checked against worked examples and deterministic calculation tests where applicable. They are not an expert suitability assessment or investment advice.
Open risk / reward tool ↗