Partial exits change the realized reward multiple
A planned target-to-stop ratio describes a particular price-distance setup.
Do not assign the final target to the whole position
A planned target-to-stop ratio describes a particular price-distance setup. If portions of the position close at different prices, the realized gross outcome depends on those quantities. Reaching a distant target with the final small portion does not mean the entire original position earned that multiple.
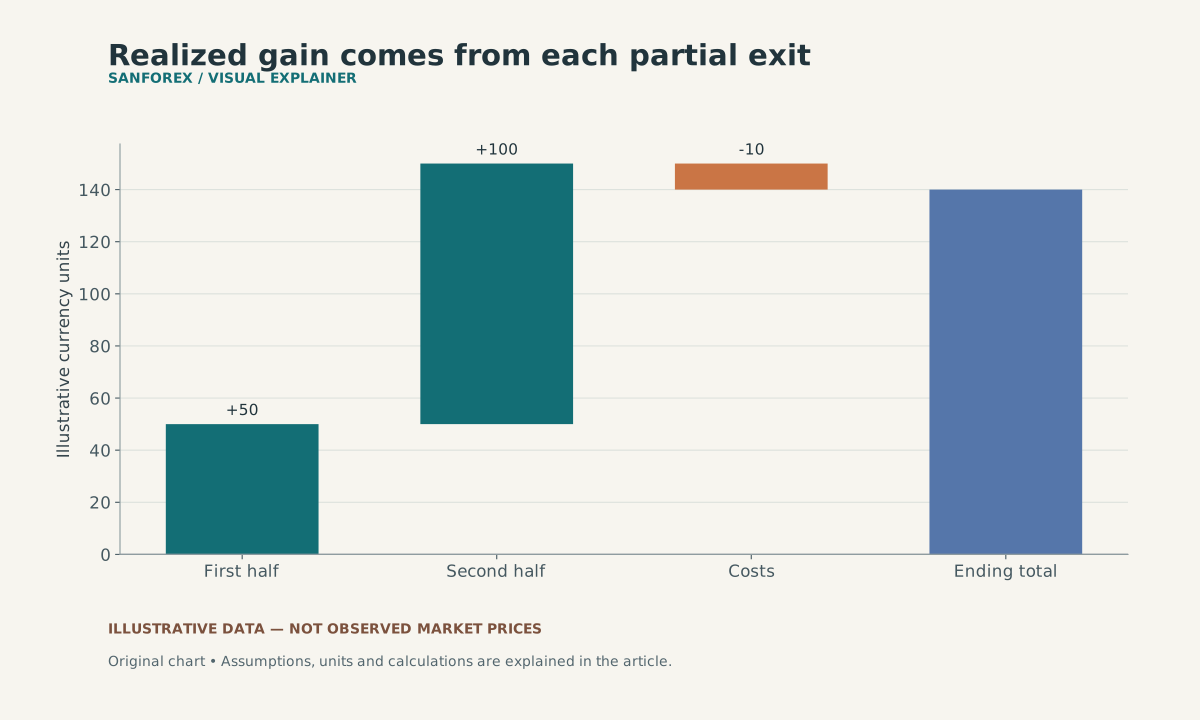
A first partial exit gains 50 and the second gains 100; costs of 10 leave 140. Relative to the original 100-unit modeled risk, gross outcome is 1.5R and net is 1.4R.
Open full-size diagram ↗Calculate a hypothetical split exit
Assume the initial modeled price-risk budget is 100 units. Half the position closes for a gain equal to one times its proportional initial risk: 50 units. The other half closes for twice its proportional initial risk: 100 units. Total gross gain is 150, or 1.5 times the original 100-unit budget. Subtracting ten units of total costs leaves 140, or 1.4 times that original budget.
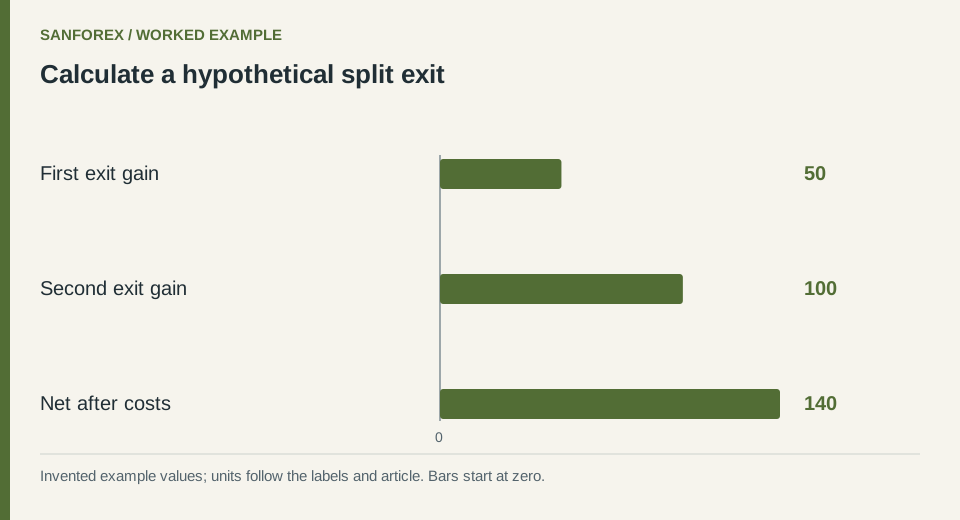
Worked example: First exit gain: 50; Second exit gain: 100; Net after costs: 140. Invented values; units follow the row labels and article.
Open full-size diagram ↗Keep the original denominator visible
If the remaining stop changes after the first exit, distinguish current remaining risk from original trade risk. Switching denominators midway can make reported multiples incomparable. Record exit quantities and realized amounts rather than reconstructing the entire trade from its highest target label. Partial fills and residual positions also need explicit treatment.
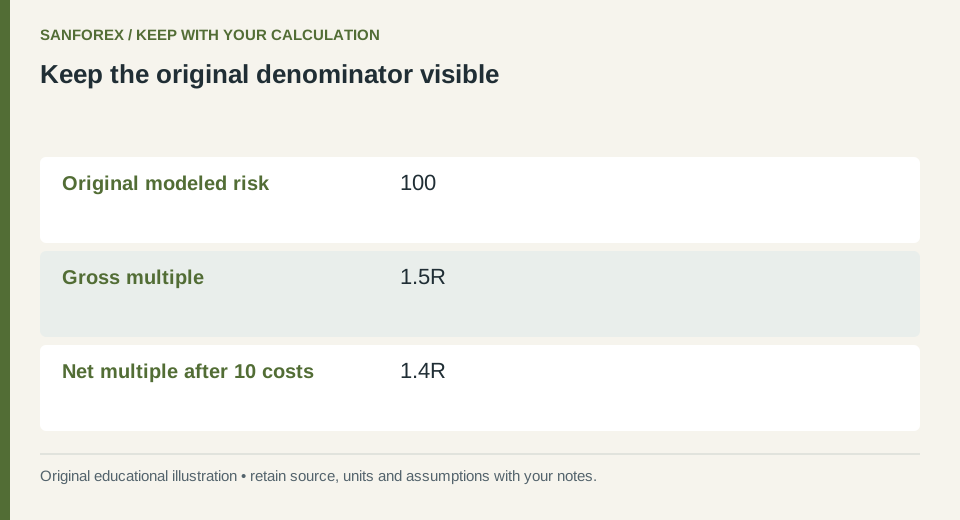
Calculation checklist: Original modeled risk: 100; Gross multiple: 1.5R; Net multiple after 10 costs: 1.4R. Preserve these definitions when reproducing the example.
Open full-size diagram ↗Compare plans with outcomes carefully
Record planned stop distance, original quantity, original risk convention, each exit and all known costs. The theoretical risk/reward tool does not simulate a sequence of partial exits or establish realized execution. The worked example assumes proportional risk and exact fills; it is not a recommendation to scale out or evidence that doing so improves results.
Sources and conventions
Examples are hypothetical. Worked examples state their formulas and assumptions in the article; our methodology explains the related calculators. Broker contract specifications determine actual lot, margin and execution conditions. These sources document definitions and data; a source link does not imply endorsement of SanForex or a trading service.
These materials are prepared with AI assistance and checked against worked examples and deterministic calculation tests where applicable. They are not an expert suitability assessment or investment advice.
Open risk / reward tool ↗