The same trade total can hide a different drawdown path
Adding a set of cash outcomes produces the same total regardless of order.
A total ignores sequence
Adding a set of cash outcomes produces the same total regardless of order. Drawdown follows a path, so changing the order can change the largest decline from a previous peak. Preserve chronological order when reviewing drawdown; sorting trades by profit can destroy the property you are trying to measure.
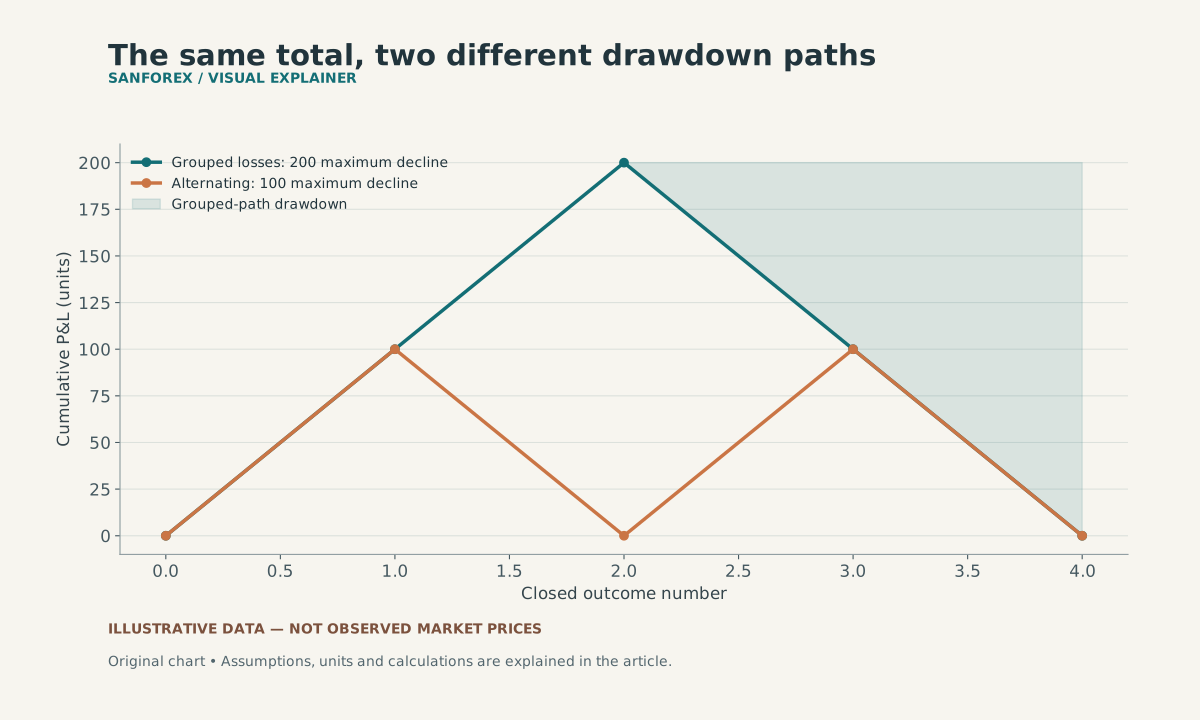
Both invented sequences end at zero cumulative P&L. The shaded gap between the grouped path and its running peak reaches 200; the alternating path’s maximum decline is 100. This is closed-result cash drawdown.
Open full-size diagram ↗Compare two invented paths
Use outcomes +100, +100, −100, −100, starting cumulative P&L at zero. The path is 100, 200, 100, zero, with a largest cash decline of 200. Reorder the same outcomes as +100, −100, +100, −100. The path becomes 100, zero, 100, zero, with a largest decline of 100. Both totals are zero. The diagrams compare cumulative P&L, not account equity or percentage drawdown.
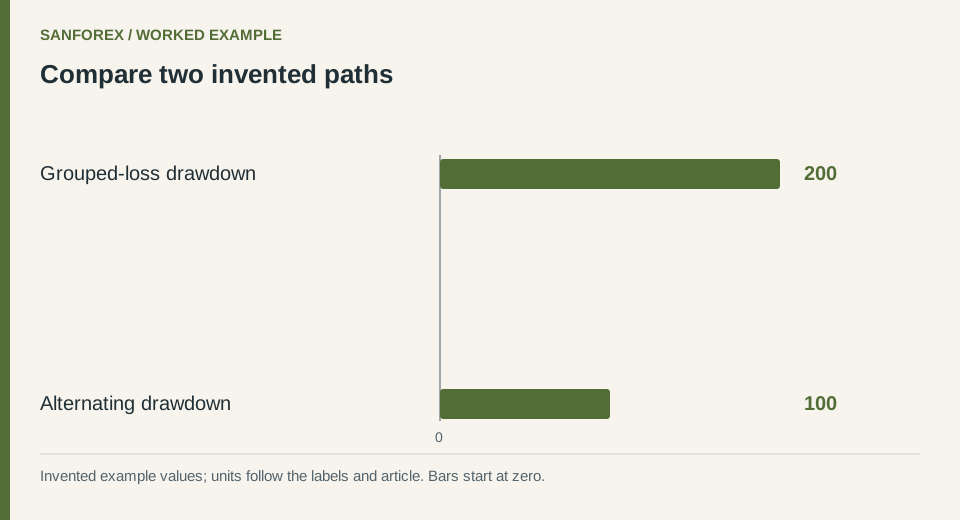
Worked example: Grouped-loss drawdown: 200; Alternating drawdown: 100. Invented values; units follow the row labels and article.
Open full-size diagram ↗Include the starting reference
A peak calculation should include the appropriate starting reference, not begin only after the first profitable observation. Specify whether the series contains closed-trade results, daily marked equity or another measure. Open-position losses can be absent from a closed-trade path, making it unsuitable as a complete account-risk description.
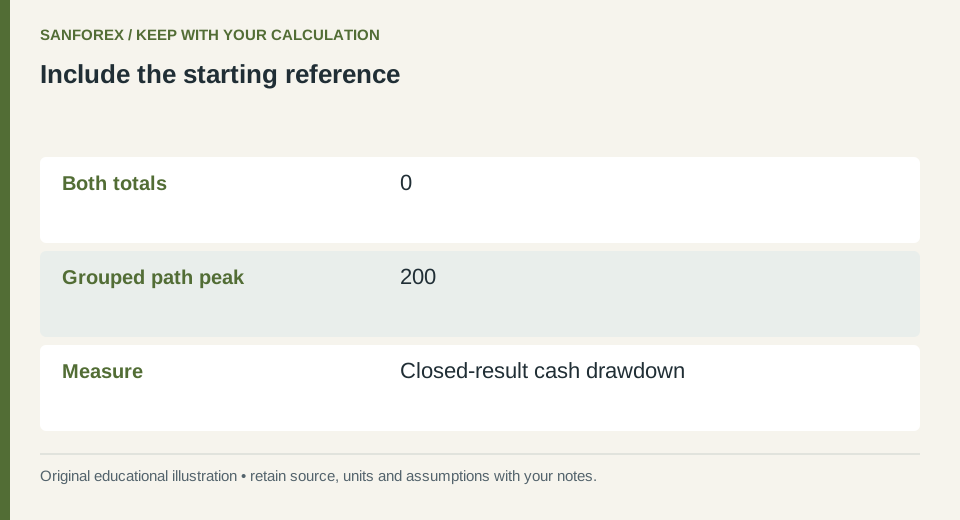
Calculation checklist: Both totals: 0; Grouped path peak: 200; Measure: Closed-result cash drawdown. Preserve these definitions when reproducing the example.
Open full-size diagram ↗Keep sorting separate from analysis
Use a display sort for browsing if needed, but calculate sequence-dependent statistics from a stable time order. If several records share a timestamp, document the tie-breaking rule. SanForex’s journal cash drawdown reflects its entered record sequence; it should not be presented as verified intraday equity drawdown.
Sources and conventions
Examples are hypothetical. Worked examples state their formulas and assumptions in the article; our methodology explains the related calculators. Broker contract specifications determine actual lot, margin and execution conditions. These sources document definitions and data; a source link does not imply endorsement of SanForex or a trading service.
These materials are prepared with AI assistance and checked against worked examples and deterministic calculation tests where applicable. They are not an expert suitability assessment or investment advice.
Open trading journal tool ↗