Multiple positions: test a joint scenario before adding risk estimates
Two position-level loss estimates do not describe every possible joint outcome.
Separate a scenario from a probability model
Two position-level loss estimates do not describe every possible joint outcome. A stress table states what happens if specified movements occur together. It need not assign probabilities. Do not call a scenario table a correlation estimate or assume apparently different instruments cannot lose at the same time.
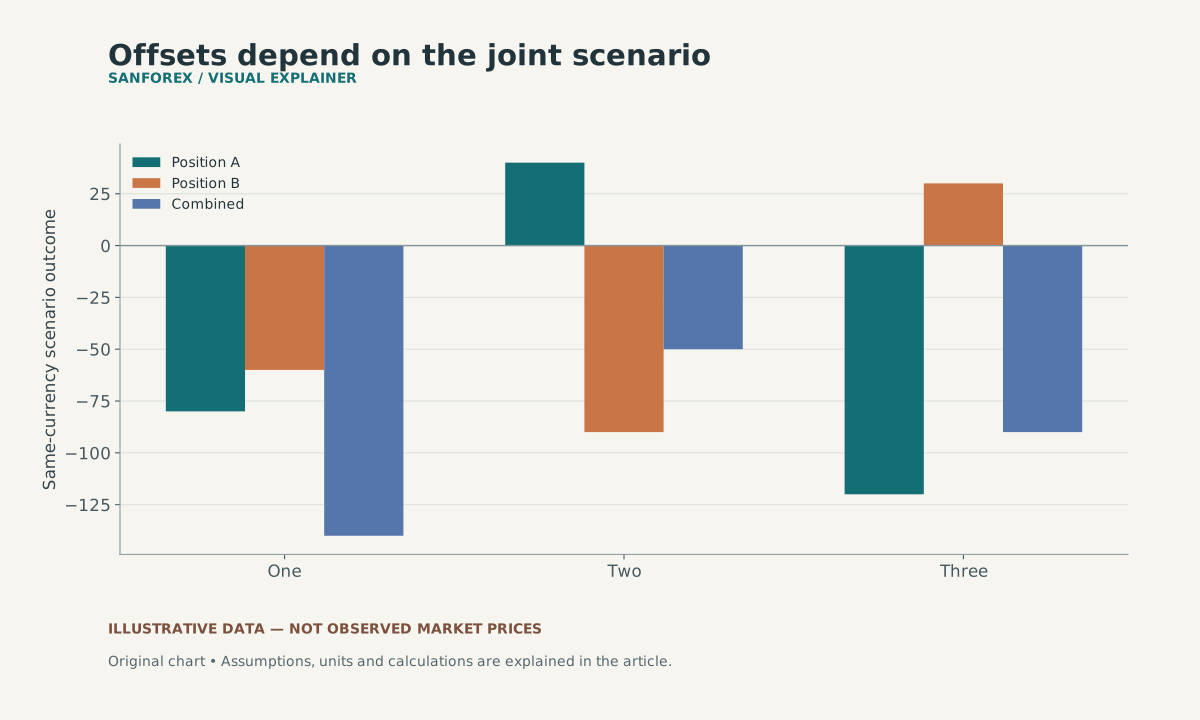
The three hypothetical joint scenarios total -140, -50 and -90. Component outcomes are supplied assumptions, with no assigned probabilities or claim that the scenarios exhaust possible losses.
Open full-size diagram ↗Build an invented two-position table
Suppose Position A loses 80 units and Position B loses 60 under Scenario One, for a combined −140. Under Scenario Two, A gains 40 while B loses 90, for −50. Under Scenario Three, A loses 120 while B gains 30, for −90. These are supplied hypothetical results, not predicted market sensitivities. All amounts must already use the same currency and cost basis before addition.
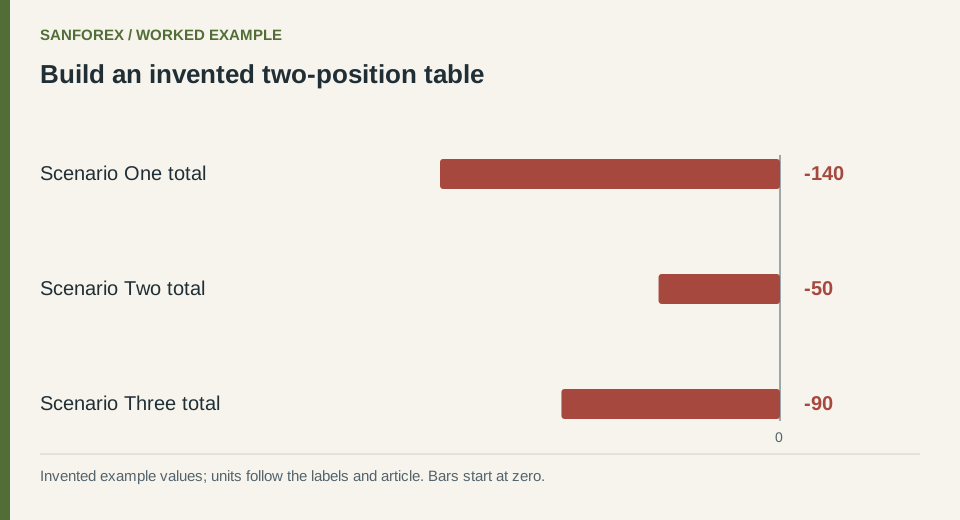
Worked example: Scenario One total: -140; Scenario Two total: -50; Scenario Three total: -90. Invented values; units follow the row labels and article.
Open full-size diagram ↗Check common assumptions across the rows
Keep position quantities fixed unless a scenario explicitly changes them. Record conversion rates and whether fees or financing are included. If both position calculations use the same underlying currency shock, do not accidentally apply that shock twice through inconsistent conversion assumptions. Verify each component before reviewing the combined total.
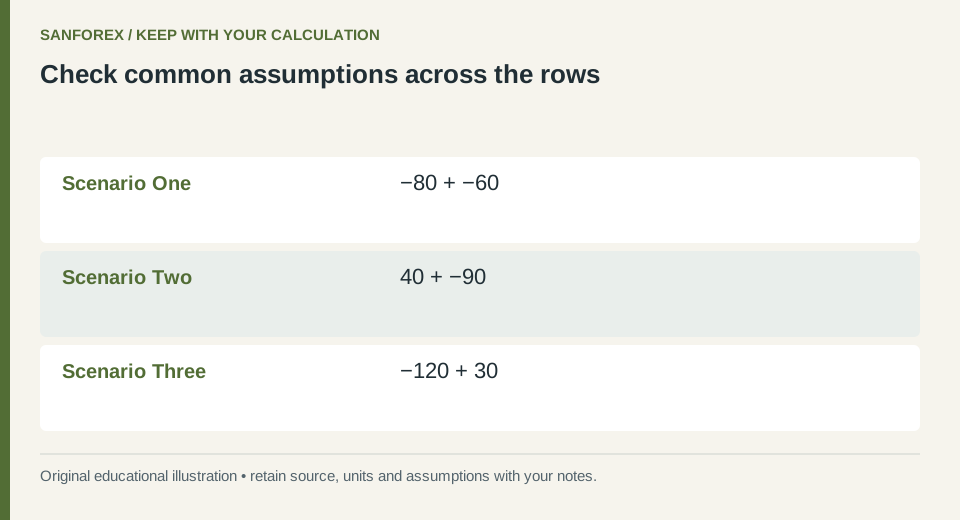
Calculation checklist: Scenario One: −80 + −60; Scenario Two: 40 + −90; Scenario Three: −120 + 30. Preserve these definitions when reproducing the example.
Open full-size diagram ↗Explain what remains outside the model
Three scenarios do not cover every possible market path, liquidity condition or execution outcome. A favorable offset in one row does not prove diversification in general. SanForex’s P&L calculator can check individual hypothetical trades; combining them into a portfolio scenario is a separate worksheet, not an automated portfolio-risk service.
Sources and conventions
Examples are hypothetical. Worked examples state their formulas and assumptions in the article; our methodology explains the related calculators. Broker contract specifications determine actual lot, margin and execution conditions. These sources document definitions and data; a source link does not imply endorsement of SanForex or a trading service.
These materials are prepared with AI assistance and checked against worked examples and deterministic calculation tests where applicable. They are not an expert suitability assessment or investment advice.
Open profit & loss tool ↗