Use journal tags to make review groups comparable
A journal tag is useful when its meaning stays consistent.
Define tags before looking at the outcome
A journal tag is useful when its meaning stays consistent. Define a setup, environment or process label in observable terms and assign it using information available at the relevant time. Retrospectively giving winners a favorable label and losers a different label creates groups that partly encode the outcome rather than explain the process.
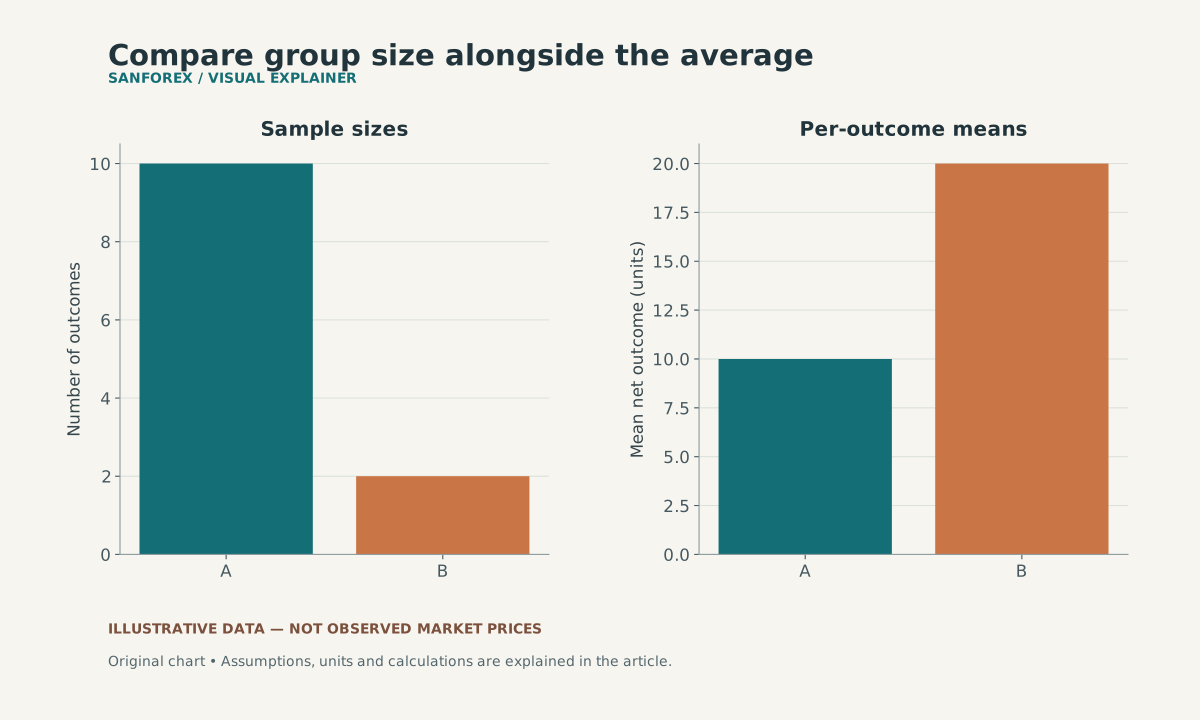
Group A has ten outcomes averaging +10, while group B has two averaging +20. The smaller group’s higher mean is not proof of a better process; totals, definitions and comparable exposure also matter.
Open full-size diagram ↗Compare totals and counts together
Suppose invented group A has ten outcomes totaling plus 100, while group B has two outcomes totaling plus 40. A has the higher total, but B has the higher mean: 10 versus 20 per outcome. That comparison alone does not establish that B is better. Its sample is much smaller, and position sizes, costs or market conditions may differ.
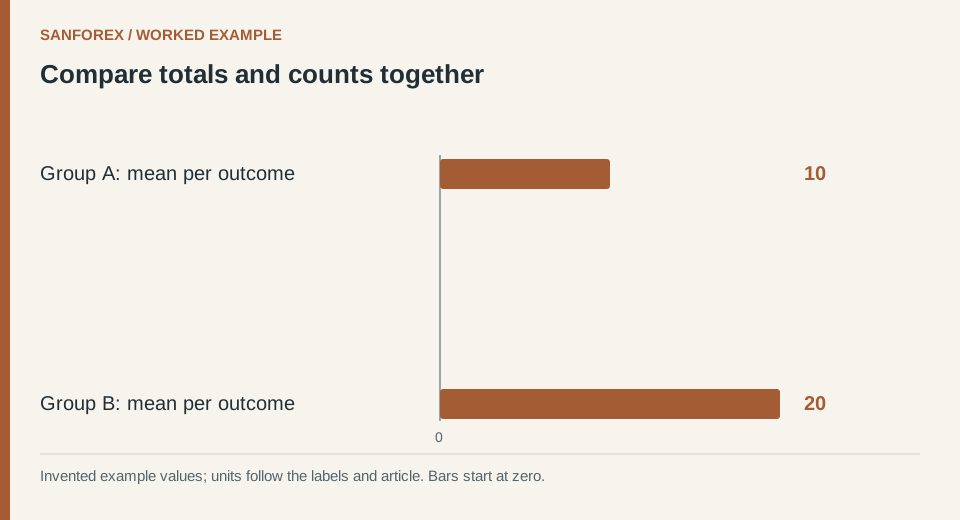
Worked example: Group A: mean per outcome: 10; Group B: mean per outcome: 20. Invented values; units follow the row labels and article.
Open full-size diagram ↗Use one consistent inclusion rule
Choose a common date range, live or simulated environment, currency basis and net-cost definition. Record how untagged and multi-tagged rows are handled. If one trade belongs to two groups, summing the group totals double-counts it unless the report explicitly uses mutually exclusive categories. Keep a reconciliation back to the unique-record total.
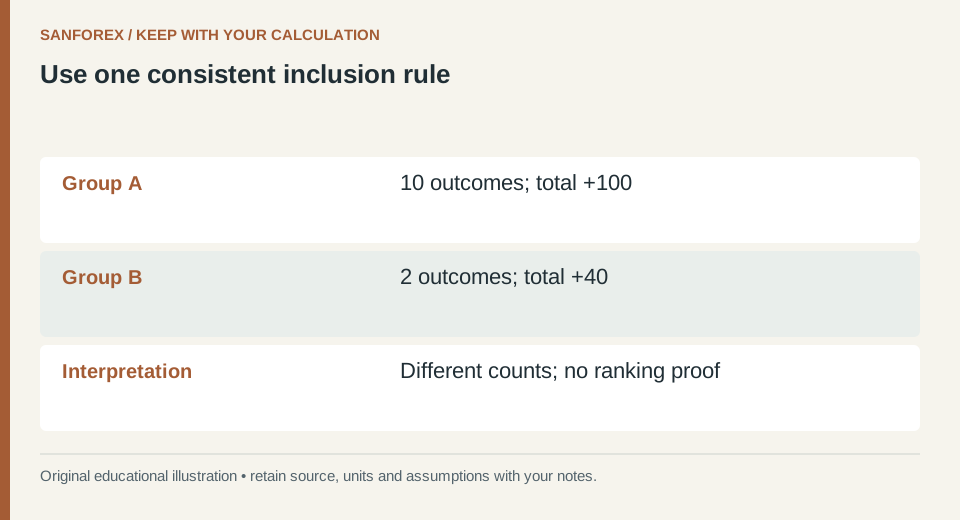
Calculation checklist: Group A: 10 outcomes; total +100; Group B: 2 outcomes; total +40; Interpretation: Different counts; no ranking proof. Preserve these definitions when reproducing the example.
Open full-size diagram ↗Version changes to the tagging scheme
When a definition changes, preserve the earlier version and identify which records were reclassified. Review both missing tags and inconsistent usage before interpreting a performance difference. Small groups are a starting point for investigating workflow, not sufficient evidence for a return forecast. A useful report makes it possible to inspect the underlying records and reproduce each count and subtotal.
Sources and conventions
Examples are hypothetical. Worked examples state their formulas and assumptions in the article; our methodology explains the related calculators. Broker contract specifications determine actual lot, margin and execution conditions. These sources document definitions and data; a source link does not imply endorsement of SanForex or a trading service.
These materials are prepared with AI assistance and checked against worked examples and deterministic calculation tests where applicable. They are not an expert suitability assessment or investment advice.
Open trading journal tool ↗