Why the unemployment rate can fall without more employment
The unemployment rate measures unemployed people as a share of the labor force, not as a share of the entire population.
Use the labor force as the denominator
The unemployment rate measures unemployed people as a share of the labor force, not as a share of the entire population. BLS defines unemployment using specific criteria; not everyone without a job meets that definition. Both the numerator and denominator can change between observations.
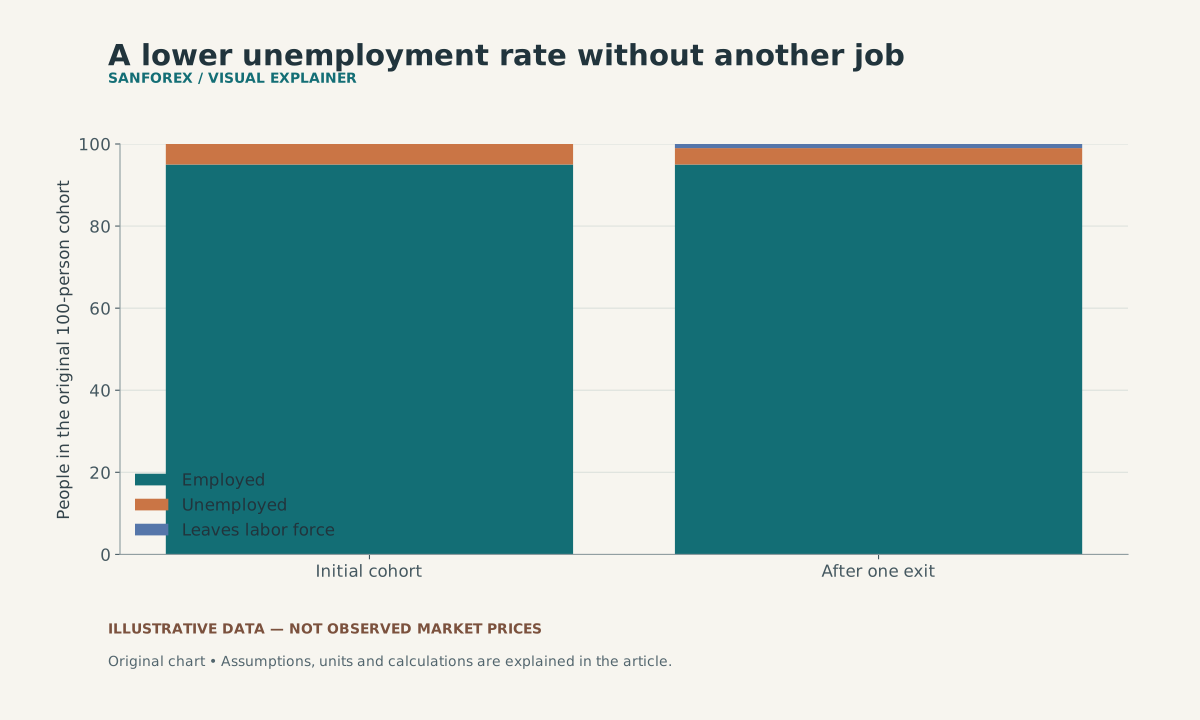
Employment remains 95 while unemployment falls from 5 to 4 because one person leaves the labor force. The rate falls from 5% to about 4.04%; the chart tracks the original cohort.
Open full-size diagram ↗Follow a hypothetical exit from the labor force
Start with 95 employed people and five unemployed people: a labor force of 100 and unemployment rate of 5%. Suppose one previously unemployed person leaves the labor force while employment stays at 95. The new rate is 4 ÷ 99 × 100 ≈ 4.04%. The rate fell even though the number employed did not rise. This toy example isolates a denominator effect, not a description of current labor conditions.
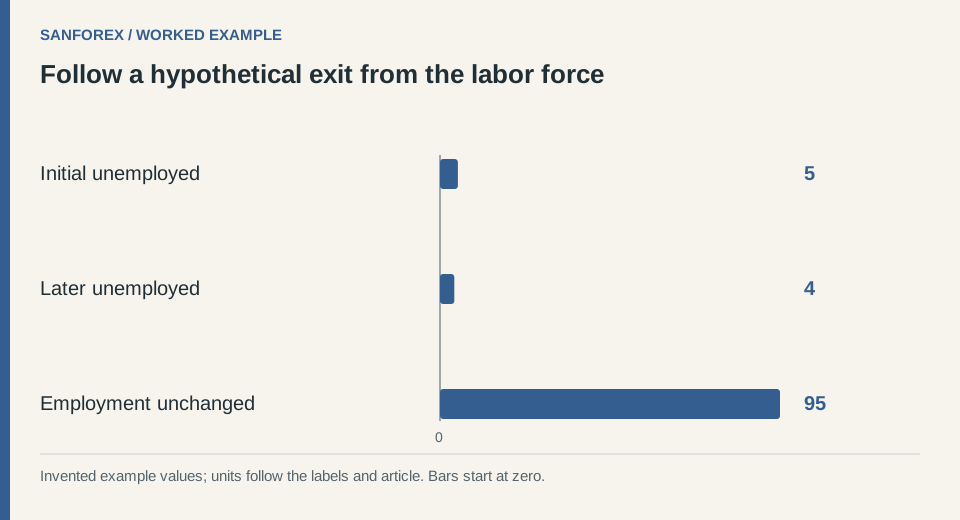
Worked example: Initial unemployed: 5; Later unemployed: 4; Employment unchanged: 95. Invented values; units follow the row labels and article.
Open full-size diagram ↗Check the surrounding counts
Write employed, unemployed and labor-force counts beside the rate. Confirm that employed plus unemployed equals the labor force within the stated rounding. To interpret a change, also examine participation and the employment-population measure using their own denominators. One ratio cannot explain every labor-market movement.
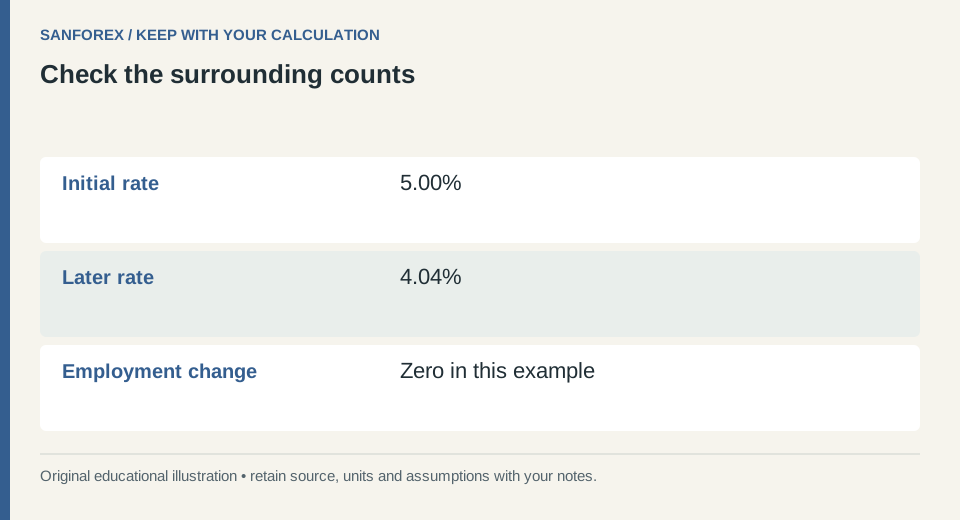
Calculation checklist: Initial rate: 5.00%; Later rate: 4.04%; Employment change: Zero in this example. Preserve these definitions when reproducing the example.
Open full-size diagram ↗Avoid overinterpreting the example
People enter and leave categories for different reasons, and published estimates have measurement uncertainty. The example does not imply every unemployment decline is weak or every increase is strong. Keep country definitions, reference period and seasonal adjustment consistent, and use the statistical release rather than a chart label alone.
Sources and conventions
Examples are hypothetical. Worked examples state their formulas and assumptions in the article; our methodology explains the related calculators. Broker contract specifications determine actual lot, margin and execution conditions. These sources document definitions and data; a source link does not imply endorsement of SanForex or a trading service.
These materials are prepared with AI assistance and checked against worked examples and deterministic calculation tests where applicable. They are not an expert suitability assessment or investment advice.
Open trading journal tool ↗